Search Results
Showing results 1 to 2 of 2
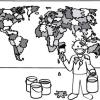
The Poor Cartographer: Graph Coloring
Source Institutions
In this activity, learners help a poor cartographer color in the countries on a map, making sure each country is colored a different color than any of its neighbors.
Making Map Projections
Source Institutions
In this activity about cartography, learners work in teams to create two different map projections: a planar (or polar) and a cylindrical (or Mercator) projection.