Search Results
Showing results 1 to 15 of 15

Earth's Energy Cycle: Albedo
Source Institutions
In this activity, learners experiment and observe how the color of materials that cover the Earth affects the amounts of sunlight our planet absorbs.

It's a Gas, Man
Source Institutions
In this activity, learners discover if carbon dioxide has an effect on temperature.

The Carbon Cycle and its Role in Climate Change: Activity 3
Source Institutions
In this activity, learners explore the human influences on the carbon cycle and examine how fossil fuels release carbon.
Understanding Albedo
Source Institutions
In this activity related to climate change, learners examine albedo and the ice albedo feedback effect as it relates to snow, ice, and the likely results of reduced snow and ice cover on global temper

Mapping Greenhouse Gas Emissions Where You Live
Source Institutions
In this lesson plan, learners examine some of the of greenhouse gas emissions sources in their community.

Avogadro's Bubbly Adventure
Source Institutions
In this activity on page 7 of the PDF, learners investigate the solubility of gas in water at different temperatures. This experiment will help learners determine if temperature affects solubility.
The Carbon Cycle and its Role in Climate Change: Activity 2
Source Institutions
In this activity (on page 7), learners explore the meaning of a "carbon sink." Using simple props, learners and/or an educator demonstrate how plants act as carbon sinks and how greenhouse gases cause
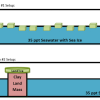
Sea Level: On The Rise
Source Institutions
Learners will understand the relationship between climate change and sea-level rise.
Differing Densities: Fresh and Salt Water
Source Institutions
In this activity, learners visualize the differences in water density and relate this to the potential consequences of increased glacial melting.
The Return of El Nino
Source Institutions
In this activity related to climate change and data analysis, learners examine temperature and precipitation data to determine if climate variations are due to El Niño.
The Carbon Cycle: How It Works
Source Institutions
In this game, learners walk through an imaginary Carbon Cycle and explore the ways in which carbon is stored in reservoirs and the processes that transport the carbon atom from one location to another
How Greenhouse Gases Absorb Heat
Source Institutions
Learners observe two model atmospheres -- one with normal atmospheric composition and another with an elevated concentration of carbon dioxide.
Investigating Convection
Source Institutions
This experiment is designed to illustrate how fluids, including water, have the ability to flow.
Causes and Effects of Melting Ice
Source Institutions
In this activity, learners explore the concept of density-driven currents (thermohaline circulation) and how these currents are affected by climate change.
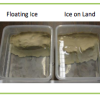
Global Climate Change and Sea Level Rise
Source Institutions
In this activity, learners practice the steps involved in a scientific investigation while learning why ice formations on land (not those on water) will cause a rise in sea level upon melting.