Search Results
Showing results 1 to 8 of 8
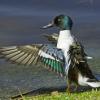
For the Birds: Environmental Effects on Population
Source Institutions
In this activity, learners will investigate how shorebirds and seabirds are extremely vulnerable to changes in their environment, whether human-induced or otherwise.

Create a Pasta Population Map
Source Institutions
Learners work as a group to create a map of their community. They use pasta to represent people, and glue the pasta on their maps to show areas of large population.
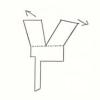
Statistics: Whirlybirds
Source Institutions
In this math lesson, learners measure, predict and determine the frequency of an event as it relates to how close Whirlybirds land to a target.

Heat Capacity: Can't Take the Heat?
Source Institutions
Why is ocean water sometimes the warmest when the average daily air temperature starts to drop? In this activity, learners explore the differing heat capacities of water and air using real data.
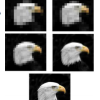
Patterns in Pixels
Source Institutions
This activity (page 2) draws upon a familiar, computer-based concept related to visual resolution: pixilation.
Without An Ark: The Effects of Storms and Floods
Source Institutions
April showers bring May flowers, but what do coastal storms bring?
Fruity-Glows: Pictures of Health on a Microarray Canvas
Source Institutions
In this activity (page 12), learners apply the concepts of pixilation and pointillism to the world of biomedical science.
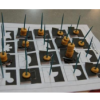
Starburst® Graph
Source Institutions
In this activity, learners use Starburst® candy to sort, classify, compare, and graph. Learners grab a handful of one-inch candy squares, sort them by color, graph the candy, and discuss the results.