Source Institutions
Source Institutions
Add to list Go to activity
Activity link broken? See if it's at the internet archive
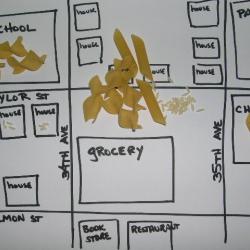
Learners work as a group to create a map of their community. They use pasta to represent people, and glue the pasta on their maps to show areas of large population. This is a good activity to introduce maps and data representation.
- Under 5 minutes
- 30 to 45 minutes
- $1 - $5 per group of students
- Ages 6 - 8
- Activity, Lesson/Lesson Plan
- English
Quick Guide
Materials List (per group of students)
- glue
- paper
- pencils
- pasta in assorted shapes
Subjects
-
Life Sciences
-
Ecology
- Populations
-
Ecology
-
Mathematics
-
Data Analysis and Probability
- Data Representation
- Representation
-
Data Analysis and Probability
-
The Nature of Technology
-
The Design Process
- Problem Solving
-
The Design Process
Informal Categories
- Food and Cooking
Audience
To use this activity, learners need to:
- see
- read
- touch
Learning styles supported:
- Involves teamwork and communication skills
- Involves hands-on or lab activities
Other
Includes alignment to state and/or national standards:
- National Council for Social Studies Curriculum Standards - Theme 3
- National Geography Standards - Standards 3 and 9
This resource is part of:
Access Rights:
- Free access
By:
- Hunter, Nancee
Rights:
- All rights reserved, National Geographic Society, 2009