Search Results
Showing results 1 to 6 of 6

Arctic Sea Ice
Source Institutions
In this activity, learners explore how the area of Arctic sea ice has changed over recent years. First, learners graph the area of Arctic sea ice over time from 1979 to 2007.
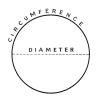
Pi Graph
Source Institutions
In this activity, learners use a straight line to learn about circles. Learners measure and record the diameter and circumference of different sized cylindrical objects on a chart.
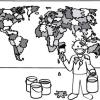
The Poor Cartographer: Graph Coloring
Source Institutions
In this activity, learners help a poor cartographer color in the countries on a map, making sure each country is colored a different color than any of its neighbors.
Cardio Comparisons
Source Institutions
In this activity, learners discover how their heart rate changes in different situations.
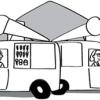
Tourist Town: Dominating Sets
Source Institutions
In this activity, learners use a fictitious map of "Tourist Town" and counters to problem solve how to place ice-cream vans on street intersections so that every other intersection is connected to one
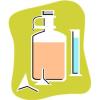
Patterns and Functions: Fill 'er Up
Source Institutions
In this math lesson, learners predict, interpret, and sketch graphs of functions related to the shapes of bottles. A measure of water is poured into a container.