Search Results
Showing results 1 to 20 of 32
Batter Up!
Source Institutions
This activity (on page 3 of the PDF under GPS: Baseball Activity) is a full inquiry investigation into how "bounciness" relates to the distance a ball will fly when hit off a batting tee.

Soccer
Source Institutions
In this math activity (Page 12 of the Play Ball! PDF), learners play a game of "soccer" and analyze the results of the game.
Quick Questions: Create a Survey
Source Institutions
In this activity, learners will conduct an open-ended survey, and then organize and analyze results. What languages does everyone speak? What’s the most common? the least common?
A Place in Space
Source Institutions
Learners construct and use a "real" 3D coordinate system out of balsa wood and foam core. They will then be able to locate coordinates in space.
Plot the Dot: A Graphical Approach to Density
Source Institutions
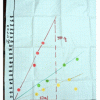
In this activity, learners work in groups to determine the mass and volume of four samples: glass marbles, steel washers or nuts, pieces of pine wood, and pieces of PVC pipe.

Basketball
Source Institutions
In this math activity (Page 14 of the Play Ball! PDF), learners play a game of "basketball" and analyze the results of the game.
Growing Plants: Track Their Growth
Source Institutions
In this activity, learners will be working with predictions with a time frame of one week, or longer. Start by planting seedlings.
The Poor Cartographer: Graph Coloring
Source Institutions
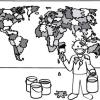
In this activity, learners help a poor cartographer color in the countries on a map, making sure each country is colored a different color than any of its neighbors.
Life in a Nutshell
Source Institutions
In this multi-faceted game (on pages 25-35), learners recreate what happens to creatures in the Brazilian rain forest as they grow from egg to adult—especially those that use fallen, empty Brazil nut
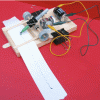
Paper Tape Motion Timer
Source Institutions
In this activity, learners build a recording timer made from simple materials (e.g., small dc motor, sharpie pen, craft sticks, adding machine paper tape, etc.).
Breakfast Sweets
Source Institutions
In this math activity, learners guess which cereals contain the most sugar. Learners use the nutrition labels on the cereal boxes to find the cereal with the least amount of sugar.

The Muddy City: Minimal Spanning Trees
Source Institutions
In this puzzle, learners investigate the decisions involved in linking a network between houses in a muddy city.

Pi Toss
Source Institutions
In this activity, learners explore a surprising method for calculating the mathematical constant pi, known as Buffon's Needle.
Tree-mendous Plots
Source Institutions
In this math lesson, learners record and graph plant growth and interpret data. Learners plant seeds, and once the seeds sprout, record the change in height of the plants for several days.
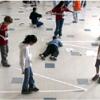
FlyBy Math: Distance-Rate-Time Problems in Air Traffic Control
Source Institutions
In this small-group activity, learners assume the roles of pilots, air traffic controllers, and NASA scientists to solve five Air Traffic Control (ATC) problems.
Population Study Game: Oh, Deer!
Source Institutions
In this activity, learners model a population of deer and see how the number of deer changes over time.
Transit Tracks
Source Institutions
In this space science activity, learners explore transits and the conditions when a transit may be seen.
How Active Are You?
Source Institutions
In this activity, learners explore what is and is not active play and how it contributes to a healthy body and mind. Making active play a routine part of every day is a key concept of the experience.
Patterns and Functions: Fill 'er Up
Source Institutions
In this math lesson, learners predict, interpret, and sketch graphs of functions related to the shapes of bottles. A measure of water is poured into a container.

Zoo Calendar
Source Institutions
Use the Zoo Calendar (page 1 of PDF) to involve learners in interdisciplinary, whole language, and writing activities about ecological concepts.
