Source Institutions
Source Institutions
Add to list Go to activity
Activity link broken? See if it's at the internet archive

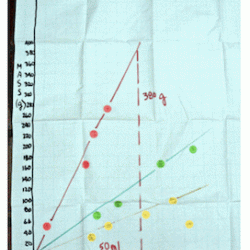
In this activity, learners work in groups to determine the mass and volume of four samples: glass marbles, steel washers or nuts, pieces of pine wood, and pieces of PVC pipe. Learners then plot the data points on a large class graph of mass vs. volume to discover that data points for a particular material form a straight line, the slope of which gives the density of the material.
- Under 5 minutes
- 45 to 60 minutes
- $10 - $20 per group of students
- Ages 11 - 18
- Activity, Experiment/Lab Activity
- English
Quick Guide
Materials List (per group of students)
- Glass marbles
- Wood pieces (ordinary pine shelving wood)
- Steel washers or nuts
- PVC pieces
- Plastic bags
- Balances
- Graduated cylinders and/or appropriately calibrated beakers or measuring cups
- Water
- Large piece of graph paper for plotting graph data
- Markers
- Labels - 3/4 in diameter circular labels for four different colors
- Straightedge
- Regular graph paper (optional)
Subjects
-
Mathematics
- Algebra
-
Data Analysis and Probability
- Data Analysis
- Data Collection
- Data Representation
-
Measurement
- Units of Measurement
- Rate
- Representation
-
The Nature of Technology
-
The Design Process
- Problem Solving
-
The Design Process
-
Physical Sciences
-
Structure and Properties of Matter
- Mass and Weight
- Volume and Density
-
Structure and Properties of Matter
-
The Nature of Science
-
The Scientific Process
- Conducting Investigations
- Gathering Data
- Formulating Explanations
- Communicating Results
-
The Scientific Process
Audience
To use this activity, learners need to:
- see
- see color
- read
- touch
Learning styles supported:
- Involves teamwork and communication skills
- Involves hands-on or lab activities
Other
This resource is part of:
Access Rights:
- Free access
By:
- Rathjen, Don
Rights:
- All rights reserved, Exploratorium, 2009
