Search Results
Showing results 1 to 4 of 4
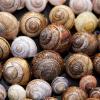
Measuring Biodiversity
Source Institutions
Learners use a variety of beans to represent a variety of species, and scatter these beans over a large piece of paper representing the environment.
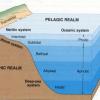
Introduction to Ocean Zones
Source Institutions
In this activity, learners will create a diagram of the ocean zones and determine what organisms live in each zone.
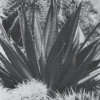
Cactus Wheel
Source Institutions
In this outdoor activity/field trip, learners explore the concept of population density.
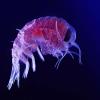
Amphipods: More than Mud
Source Institutions
In this data analysis and environmental science activity, learners examine the effects of pollution on amphipods using data from the Chesapeake Ecotox Research Program.