Search Results
Showing results 1 to 11 of 11
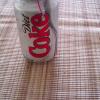
Diet Light
Source Institutions
In this quick activity, learners observe how the added sugar in a can of soda affects its density and thus, its ability to float in water.

Good News: We're on the Rise!
Learners build a simple aneroid barometer to learn about changes in barometric pressure and weather forecasting. They observe their barometer and record data over a period of days.
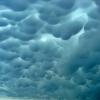
Head in the Clouds
Source Institutions
In this activity, learners create a CloudSpotter wheel and record the different types of clouds they observe twice daily over several days.

It's the "Rain," Man
Source Institutions
In this weather forecasting activity, learners use common materials to construct a rain gauge and measure daily, monthly, and yearly rainfall.

Drawing Conclusions
Source Institutions
In this weather forecasting activity, learners determine the location of cold and warm fronts on weather plot maps.
I Can't Take the Pressure!
Learners develop an understanding of air pressure in two different activities.
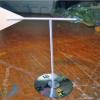
Weather Vane
Source Institutions
In this meteorology activity, learners build weather vanes using straws, paperclips, and cardstock.

The Daily Ups and Downs
Source Institutions
In this activity, learners graph 48 hourly air temperatures from a local weather observation site and observe the diurnal temperature variations.
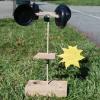
Weather Vane and Anemometer
Source Institutions
In this meteorology activity, learners construct simple devices to measure the direction and speed of wind.

Forward Thinking
Source Institutions
In this activity, learners create their own weather forecast map.

If Anyone Can, Icon
Source Institutions
In this activity, learners create their own icons for a forecast-at-a-glance poster for their classroom/learning space.