Search Results
Showing results 1 to 11 of 11
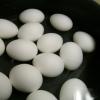
Salt 'n Lighter
Source Institutions
In this activity, learners discover that as the salinity of water increases, the density increases as well. Learners prove this by attempting to float fresh eggs in saltwater and freshwater.
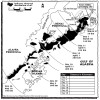
Fragile Waters
Source Institutions
In this activity (on pages 18-29) learners explore the impact of the March 24, 1989 oil spill in Alaska caused by the Exxon Valdez tanker.
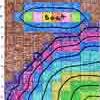
Map That Habitat
Source Institutions
Historically, sea floor mapping (bathymetry) was done by soundings.
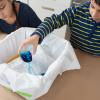
Simple Submarine
Source Institutions
Using simple, inexpensive items, learners build and test submarine models.

A Degrading Experience
Source Institutions
In this activity on page 27, learners perform an experiment to learn about how different types of marine debris degrade and how weather and sunlight affect the rate of degradation.
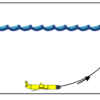
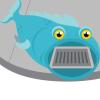
Exploring the Ocean with Robots
Source Institutions
In this activity, learners are introduced to robotic submarines called gliders. Learners make “gliders” from plastic syringes and compare these to Cartesian bottles and plastic bubbles.
Building A Storm Drain
Source Institutions
In this design challenge, learners design a storm drain cover that catches litter to protect waterways to learn about how local actions can have system-level effects.
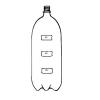
Under Pressure
Source Institutions
In this experiment, learners examine how pressure affects water flow. In small groups, learners work with water and a soda bottle, and then relate their findings to pressure in the deep ocean.

Heat Capacity: Can't Take the Heat?
Source Institutions
Why is ocean water sometimes the warmest when the average daily air temperature starts to drop? In this activity, learners explore the differing heat capacities of water and air using real data.
Make a Lake
Source Institutions
Where rainwater goes after the rain stops? And why there are rivers and lakes in some parts of the land but not in others?
Mountains in the Sea
Source Institutions
In this 6-7 day investigation, learners begin with an introduction to seamounts that are present in the Gulf of Alaska.