Search Results
Showing results 1 to 8 of 8

That Sinking Feeling
Source Institutions
In this quick activity, learners observe how salinity and temperature affect the density of water, to better understand the Great Ocean Conveyor.

Drawing Conclusions
Source Institutions
In this weather forecasting activity, learners determine the location of cold and warm fronts on weather plot maps.
Canned Heat
Source Institutions
In this activity, learners explore how light and dark colored objects absorb the Sun's radiations at different rates.

The Daily Ups and Downs
Source Institutions
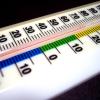
In this activity, learners graph 48 hourly air temperatures from a local weather observation site and observe the diurnal temperature variations.

It's a Gas, Man
Source Institutions
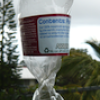
In this activity, learners discover if carbon dioxide has an effect on temperature.
Crunch Time
Source Institutions
In this quick and easy activity and/or demonstration, learners use two empty 2-liter bottles and hot tap water to illustrate the effect of heat on pressure.

Forward Thinking
Source Institutions
In this activity, learners create their own weather forecast map.

If Anyone Can, Icon
Source Institutions
In this activity, learners create their own icons for a forecast-at-a-glance poster for their classroom/learning space.