Search Results
Showing results 1 to 18 of 18
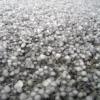
Sizing Up Hail
Source Institutions
In this activity, learners will estimate the sizes of balls to learn how to estimate the size of hail. Learners will compare their estimates to the estimates of their peers and the real measurements.
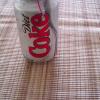
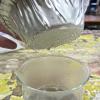
Diet Light
Source Institutions
In this quick activity, learners observe how the added sugar in a can of soda affects its density and thus, its ability to float in water.

Good News: We're on the Rise!
Learners build a simple aneroid barometer to learn about changes in barometric pressure and weather forecasting. They observe their barometer and record data over a period of days.

Twirling in the Breeze
Source Institutions
In this engineering activity, learners build a device (an anemometer) to measure how fast the wind is blowing.
Running in Circles
Source Institutions
In this group activity, learners use some common objects and work together to simulate the Coriolis effect. During the challenge, learners make predictions and test different scenarios.

Measure the Pressure: The "Wet" Barometer
Source Institutions
In this activity, learners use simple items to construct a device for indicating air pressure changes.
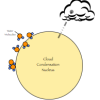
Do Cities Affect the Weather?
Source Institutions
In this activity, learners explore clouds and how they form.

A Degrading Experience
Source Institutions
In this activity on page 27, learners perform an experiment to learn about how different types of marine debris degrade and how weather and sunlight affect the rate of degradation.
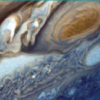
Weather Stations: Storms
Source Institutions
In this activity, learners test how cornstarch and glitter in water move when disturbed. Learners compare their observations with videos of Jupiter's and Earth's storm movements.
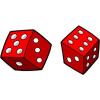
Probability: Chances Are
Source Institutions
In this math lesson, learners identify the likelihood of an event by using a walk-on probability scale.
Wonderful Weather
Source Institutions
In this activity, learners conduct three experiments to examine temperature, the different stages of the water cycle, and how convection creates wind.

What's the Difference between Weather and Climate?
Source Institutions
In this interactive and informative group activity, learners use packages of M&M's to illustrate the difference between weather and climate.
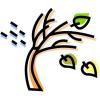
Where Does the Wind Blow?
Source Institutions
In this activity, learners investigate wind by comparing the force of wind in different locations. Learners build wind-o-meters out of wooden sticks and strips of paper.

Measure the Pressure II: The "Dry" Barometer
Source Institutions
In this activity, learners use simple items to construct a device for indicating air pressure changes.

If Anyone Can, Icon
Source Institutions
In this activity, learners create their own icons for a forecast-at-a-glance poster for their classroom/learning space.
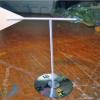
Weather Vane
Source Institutions
In this meteorology activity, learners build weather vanes using straws, paperclips, and cardstock.
I Can't Take the Pressure!
Learners develop an understanding of air pressure in two different activities.
Without An Ark: The Effects of Storms and Floods
Source Institutions
April showers bring May flowers, but what do coastal storms bring?