Search Results
Showing results 1 to 20 of 22

Dripping Wet or Dry as a Bone?
Learners investigate the concept of humidity by using a dry and wet sponge as a model. They determine a model for 100% humidity, a sponge saturated with water.

How Much Water is in that Cloud?
Source Institutions
In this activity, learners working in pairs saturate a cotton ball using water drops from an eyedropper to demonstrate the high water capacity of clouds.

Good News: We're on the Rise!
Learners build a simple aneroid barometer to learn about changes in barometric pressure and weather forecasting. They observe their barometer and record data over a period of days.

Weather and Climate: What's the Difference?
Source Institutions
This lesson plan enables learners to explore the differences between weather and climate.
Weather Forecasting
Source Institutions
This activity (on page 2 of the PDF under SciGirls Activity: Forecasting) is a full inquiry investigation into meteorology and forecasting.

It's the "Rain," Man
Source Institutions
In this weather forecasting activity, learners use common materials to construct a rain gauge and measure daily, monthly, and yearly rainfall.

Drawing Conclusions
Source Institutions
In this weather forecasting activity, learners determine the location of cold and warm fronts on weather plot maps.
The Return of El Nino
Source Institutions
In this activity related to climate change and data analysis, learners examine temperature and precipitation data to determine if climate variations are due to El Niño.

Lift Off!
Source Institutions
This activity (on page 2 of the PDF under SciGirls Activity: Lift Off) is a full inquiry investigation into the engineering challenges of sending scientific sensors into space.

The Daily Ups and Downs
Source Institutions
In this activity, learners graph 48 hourly air temperatures from a local weather observation site and observe the diurnal temperature variations.
Creating a Soil Map
Source Institutions
In this activity, learners investigate soil conditions by creating a soil map. Learners record soil characteristics and compare the conditions of soil in different grid sections.
Measuring the Wind
Source Institutions
In this activity, learners explore how anemometers work to record wind speeds and how the equipment has undergone engineering adaptations over time.

What's the Difference between Weather and Climate?
Source Institutions
In this interactive and informative group activity, learners use packages of M&M's to illustrate the difference between weather and climate.
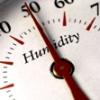
Making Sense of Sensors
Source Institutions
In this activity, learners explore sensors and focus specifically on how to measure humidity using a sensor.
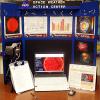
Space Weather Action Center
Source Institutions
In this interdisciplinary activity, learners create a Space Weather Action Center (SWAC) to monitor solar storms and develop real SWAC news reports.

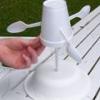
Twirling in the Breeze
Source Institutions
In this engineering activity, learners build a device (an anemometer) to measure how fast the wind is blowing.

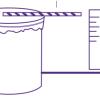
Measure the Pressure: The "Wet" Barometer
Source Institutions
In this activity, learners use simple items to construct a device for indicating air pressure changes.
Make Your Own Weather Station
Source Institutions
This three-part activity shows learners how to build three meteorology tools: a wind vane, a rain gauge, and a barometer.

Forward Thinking
Source Institutions
In this activity, learners create their own weather forecast map.
AM in the PM
Source Institutions
In this activity, learners will listen to as many radio stations as possible to discover that AM radio signals can travel many hundreds of miles at night.