Search Results
Showing results 1 to 20 of 24
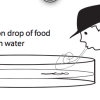
Blowin’ Up a Storm of Oil
Source Institutions
In this activity, learners investigate how wind can create surface currents and how waves move. Learners also discover how wind can affect oil spills.
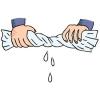
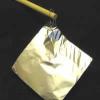
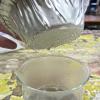
Drying It Out
Source Institutions
In this activity, learners investigate and compare the rate of drying in different conditions.
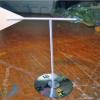
Going for a Spin: Making a Model Steam Turbine
Source Institutions
In this activity, learners explore how various energy sources can be used to cause a turbine to rotate.
Twist and Spout
Source Institutions
In this activity, learners make their own "tornado" using two soda bottles and water.
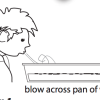
Catch a Wave: How Waves are Formed
Source Institutions
In this three-part activity, learners explore how waves are formed and why some waves are bigger than others. First, learners observe waves of water in a pan generated by an electric fan.

Drawing Conclusions
Source Institutions
In this weather forecasting activity, learners determine the location of cold and warm fronts on weather plot maps.
The Return of El Nino
Source Institutions
In this activity related to climate change and data analysis, learners examine temperature and precipitation data to determine if climate variations are due to El Niño.
Getting Windy
Source Institutions
In this activity, learners create and understand surface currents. Learners create example surface currents and discover how landmasses affect the current.
Weather Stations: Winds
Source Institutions
In this activity, learners use a toaster to generate wind and compare the appliance's heat source to Jupiter's own hot interior. Learners discover that convection drives wind on Jupiter and on Earth.

Toasty Wind
Source Institutions
In this quick activity, learners use a toaster to investigate the source for the Earth's wind. Learners hold a pinwheel above a toaster to discover that rising heat causes wind.
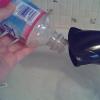
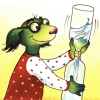
Air Pressure
Source Institutions
In this experiment, learners use a blow dryer and water bottle to observe and record changes in air pressure caused by changes in temperature.
Weather Vane
Source Institutions
In this meteorology activity, learners build weather vanes using straws, paperclips, and cardstock.
A Pressing Engagement
Source Institutions
In this quick and easy activity and/or demonstration, learners illustrate the effect of the weight of air over our heads.
Wonderful Weather
Source Institutions
In this activity, learners conduct three experiments to examine temperature, the different stages of the water cycle, and how convection creates wind.
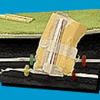
Puff Mobile
Source Institutions
In this engineering activity, challenge learners to design a car using only 3 straws, 4 Lifesavers™, 1 piece of paper, 2 paper clips, tape, and scissors.
Mini Glacier Meltdown
Source Institutions
This activity (located on page 3 of the PDF under GPS: Glaciers Activity) is a full inquiry investigation about the different causes of glacial melt.
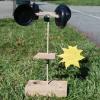
Weather Vane and Anemometer
Source Institutions
In this meteorology activity, learners construct simple devices to measure the direction and speed of wind.
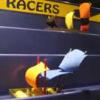
Ships Ahoy!
Source Institutions
The goal of this activity is to design the fastest sailboat or one that carries the most treasure.

Twirling in the Breeze
Source Institutions
In this engineering activity, learners build a device (an anemometer) to measure how fast the wind is blowing.
Sea State: Forecast Conditions at Sea
Source Institutions
In this oceanography and data collection activity, learners cast real time sea state conditions using buoys from NOAA's National Data Buoy Center.