Search Results
Showing results 1 to 15 of 15
The Geophysical Light/Dark Cycle
Source Institutions
This is an activity (located on page 131 of the PDF) related to sleep and circadian rhythms as well as space travel.

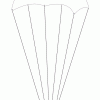
Incredible Shrinking Shapes
Source Institutions
In this activity, learners get hands-on experience with ratios and scaling while making their own jewelry out of recycled plastic containers.

A Cubic Foot Per Second
Source Institutions
In this activity, learners measure and calculate the amount of cubic feet various containers contain. Next, learners investigate cubic feet per second (cps), by carrying jugs in one second.
Relative Speed of Dinosaurs
Source Institutions
In this activity, learners interpret three trackways and use measurements and a formula to infer the relative speed of dinosaurs.

Mapping Greenhouse Gas Emissions Where You Live
Source Institutions
In this lesson plan, learners examine some of the of greenhouse gas emissions sources in their community.
Your Energy Needs
Source Institutions
In this activity about the relationship between food and energy (page 8 of PDF), learners estimate average daily baseline energy (Calorie) needs and energy needs for different levels of activity.
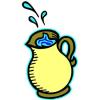
Aesop's Arithmetic
Source Institutions
In this activity (located on page 9 of the PDF), learners are introduced to Aesop's fable, "The Crow and the Pitcher." In the story, a clever crow drops pebbles into a pitcher to cause the water level
The Parachuting Egg
Source Institutions
In this activity, learners work in groups to design a parachute out of household items that keeps an egg secure when dropped from a certain height.
Fill it to Capacity
Source Institutions
In this math lesson, learners rotate through six estimating and measuring centers. First, learners read the book, "Room for Ripley" by Stuart J.
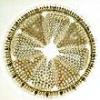
Diatom Ooze: Ooze Clues
Source Institutions
In this activity, learners will plot the distribution of various oozes using information from sediment maps.
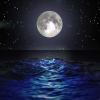
The Ins and Outs of Tides: Learn About Causes and Predictions
Source Institutions
In this activity, learners will compare predicted and observed tides using data from The National Oceanic and Atmospheric Administration(NOAA).

Drawing Conclusions
Source Institutions
In this weather forecasting activity, learners determine the location of cold and warm fronts on weather plot maps.
Mass of the Earth
Source Institutions
In this activity, learners use basic measurements of the Earth and pieces of rock and iron to estimate the mass of the Earth.
Energy Audit
Source Institutions
In this lesson, learners will practice graphing and statistically analyzing data.
Servings and Choices
Source Institutions
In this nutrition activity (page 16 of PDF), learners document their individual eating habits and learn whether their eating patterns meet their needs.