Search Results
Showing results 61 to 80 of 126
Sharks: Taking a Bite Out of The Myth
Source Institutions
In this activity, learners will explore trends in shark populations using shark landing data from the National Marine Fisheries Service.
Water, Water Everywhere
Source Institutions
In this activity, learners estimate how much water they think can be found in various locations on the Earth in all its states (solid, liquid, and gas) to discover the different water ratios in the Ea
Animal Guess Who
Source Institutions
In this game, learners take turns guessing toy animals from around their house based on the toy's characteristics.
The Carbon Cycle and its Role in Climate Change: Activity 2
Source Institutions
In this activity (on page 7), learners explore the meaning of a "carbon sink." Using simple props, learners and/or an educator demonstrate how plants act as carbon sinks and how greenhouse gases cause
A Pressing Engagement
Source Institutions
In this quick and easy activity and/or demonstration, learners illustrate the effect of the weight of air over our heads.

Hieroglyph Holiday
Source Institutions
In this activity about archaeology, learners will explore different Egyptian hieroglyphs and recognize their meanings and uses.

The Daily Ups and Downs
Source Institutions
In this activity, learners graph 48 hourly air temperatures from a local weather observation site and observe the diurnal temperature variations.
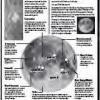
Observing the Moon
Source Institutions
Use this Moon Map Guide to help learners identify features on the Moon, while looking through a telescope.
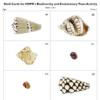
Biodiversity and Evolutionary Trees
Source Institutions
In this interactive activity, learners analyze seashells to explore phylogeny and evolution. Learners identify similar and dissimilar seashells to create a phylogenetic tree.
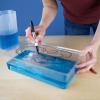
Exploring Earth: Rising Sea
Source Institutions
“Exploring Earth: Rising Sea” is a hands-on activity demonstrating ways to use topographical mapping techniques to track changes in sea level. The activity is connected to current NASA research.
Gravity Launch
Source Institutions
In this online game, learners attempt to send a rocket ship to various targets. Learners can adjust the angle and thrust of the rocket before it is launched.
The Great Balloon Race
Source Institutions
In this online Flash game, learners take to the skies in a hot air balloon and are challenged to beat other balloonists' times to the finish line without crashing.
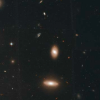
Coma Cluster of Galaxies
Source Institutions
In this activity, learners will first learn the basics of galaxy classification and grouping.
Tsunami: Waves of Destruction
Source Institutions
In this activity, learners use tsunami time travel maps to predict how long it will take a tsunami to reach the shore.
Solar Spin
Source Institutions
A group of learners models the Sun shining on the Earth. By rotating the Earth, they demonstrate how the Sun only shines on a portion of the Earth at a time.
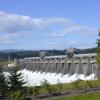
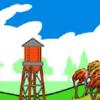
The Best Dam Simulation Ever
Source Institutions
This online simulation game explores the different consequences of water levels on the Columbia River in the Pacific Northwest.
Buzz Lightyear Connect It!: Flight Path Activity
Source Institutions
In this activity, "space cadets" (learners) use writing and sequencing skills in addition to directional words/ordered pairs to guide Buzz Lightyear (from the movie "Toy Story") through a grid to reac
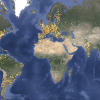
Globe at Night
Source Institutions
In this international citizen science activity, learners measure their night sky brightness and submit their observations into an online database.

Go with the Flow
Source Institutions
In this quick and easy activity and/or demonstration, learners use two empty soda cans to illustrate Bernoulli's principle.
Fish Eyes: More than Meets the Eye
Source Institutions
In this data collection and analysis activity, learners evaluate fish physiology and ecology using vision research data from Dr.