Search Results
Showing results 1 to 8 of 8
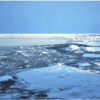
Arctic Sea Ice
Source Institutions
In this activity, learners explore how the area of Arctic sea ice has changed over recent years. First, learners graph the area of Arctic sea ice over time from 1979 to 2007.
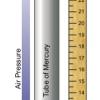
Measure the Pressure: The "Wet" Barometer
Source Institutions
In this activity, learners use simple items to construct a device for indicating air pressure changes.

The Shadow Knows II
Source Institutions
In this activity, learners will measure the length of a shadow and use the distance from the equator to calculate the circumference of the earth.

Using Different Models of Earth
Source Institutions
In this activity, learners explore how the shapes, sizes, and distances of land masses appear differently on two different models of Earth: an icosahedron and a flat map.
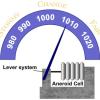
Measure the Pressure II: The "Dry" Barometer
Source Institutions
In this activity, learners use simple items to construct a device for indicating air pressure changes.

Drawing Conclusions
Source Institutions
In this weather forecasting activity, learners determine the location of cold and warm fronts on weather plot maps.
AM in the PM
Source Institutions
In this activity, learners will listen to as many radio stations as possible to discover that AM radio signals can travel many hundreds of miles at night.
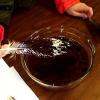
Find the Best Way to Clean Oil off Bird Feathers
Source Institutions
In this experiment, learners examine the way oil affects bird feathers and test different cleanup methods to find out which works best.
