Search Results
Showing results 1 to 8 of 8

Chances Are: OH NO! Look Out Below for a UFO
Source Institutions
In this math lesson (on Page 13), learners predict and simulate the likelihood of an event occurring.

Chances Are: It's a Mystery to Me
Source Institutions
In this math lesson, learners extend their understanding of basic probability concepts as they learn to name all of the possible outcomes of an event as well as ways to express the likelihood of such
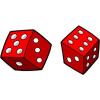
Probability: Chances Are
Source Institutions
In this math lesson, learners identify the likelihood of an event by using a walk-on probability scale.
Number Sense and Computation: Food For Thought
Source Institutions
In this math lesson, learners identify and compare unit costs of given items. Learners use computation skills, problem solving and number sense to find the cost of an ounce of cereal.
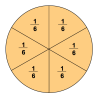
Number Sense and Computation: To Half or Half Not
Source Institutions
In this math lesson, learners use slices of bread and geoboards to explore several ways to divide a rectangle in half. Learners also identify equivalent fractions that represent one-half.
Statistics: Whirlybirds
Source Institutions
In this math lesson, learners measure, predict and determine the frequency of an event as it relates to how close Whirlybirds land to a target.

Statistics: Something Fishy
Source Institutions
In this math lesson, learners apply the concepts of ratio and proportion to the capture-recapture statistical procedure.
Computation and Estimation: Alphabits
Source Institutions
In this math lesson, learners apply the concepts of ratios and percentages to the distribution of letters contained in a box of Alphabits® cereal.
