Search Results
Showing results 1 to 20 of 46
Best Bubbles
Source Institutions
In this activity, learners experiment with creating various types of bubble solutions and testing which ingredients form longer-lasting bubbles.
Inverse Functions: Pennies, Pressure, Temperature, and Light
Source Institutions
The major goal of this math lesson is to have learners collect data from a variety of experiments, determine what models best fits their data, and explain why their models are best.
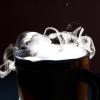
Sublime Sublimation
Source Institutions
In this activity, learners explore sublimation by conducting experiments with dry ice.
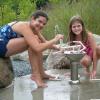
Measure the Speed of a Water Leak
Source Institutions
In this activity (page 2 of PDF under GPS: Glaciers Activity), learners will measure the rate at which water streams out of a leaky cup.
Space Stations: Sponge Spool Spine
Source Institutions
In this activity, learners simulate what happens to a human spine in space by making Sponge Spool Spines (alternating sponge pieces and spools threaded on a pipe cleaner).
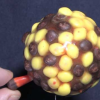
Dunking the Planets
Source Institutions
In this demonstration, learners compare the relative sizes and masses of scale models of the planets as represented by fruits and other foods.
Gravity Fail
Source Institutions
In this activity, learners try pouring water out of a regular cup and a miniature cup. It’s harder than it sounds! Learners discover that different forces dominate at different size scales.
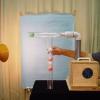
Going for a Spin: Making a Model Steam Turbine
Source Institutions
In this activity, learners explore how various energy sources can be used to cause a turbine to rotate.

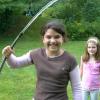
Twirling in the Breeze
Source Institutions
In this engineering activity, learners build a device (an anemometer) to measure how fast the wind is blowing.
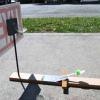
Parabola Basketball
Source Institutions
In this activity, learners build mini-basketball courts and explore the laws of physics. Learners discover that everything you throw or shoot on earth travels in a parabola.
Sea State: Forecast Conditions at Sea
Source Institutions
In this oceanography and data collection activity, learners cast real time sea state conditions using buoys from NOAA's National Data Buoy Center.

Percentage of Oxygen in the Air
Source Institutions
In this activity, learners calculate the percentage of oxygen in the atmosphere by using steel wool's ability to rust.

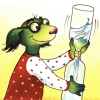
Measure the Pressure: The "Wet" Barometer
Source Institutions
In this activity, learners use simple items to construct a device for indicating air pressure changes.
Gravity Fountains
Source Institutions
This activity (located on page 3 of the PDF under GPS: Glaciers Activity) is a full inquiry investigation into the forces of gravity and air pressure.
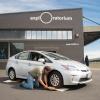
Tired Weight
Source Institutions
Yes, you can weigh your car by figuring out your wheel's tire pressure combined with the "tire's footprint." You'll need someone with a car, driver's license, and safety in mind.
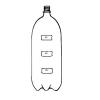
Twist and Spout
Source Institutions
In this activity, learners make their own "tornado" using two soda bottles and water.
Ping Pong Ball Shooter
Source Institutions
In this activity, learners use ABS pipe and an air leaf blower to make a strong shooting machine.
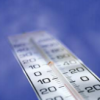
Weather Stations: Temperature and Pressure
Source Institutions
In this activity, learners discover the relationship between temperature and pressure in the lower atmospheres of Jupiter and Earth.
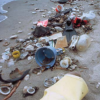
Trash Traits
Source Institutions
In this activity on page 24, learners perform experiments to examine whether or not trash can float, blow around, or wash away.
Under Pressure
Source Institutions
In this experiment, learners examine how pressure affects water flow. In small groups, learners work with water and a soda bottle, and then relate their findings to pressure in the deep ocean.