Search Results
Showing results 1 to 20 of 105
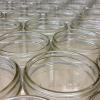
Hot Stuff!: Investigation #4
Learners test two jars containing soil, one covered and one open, for changes in temperature. After placing the jars in the Sun, learners discover that the covered jar cools down more slowly.

Dripping Wet or Dry as a Bone?
Learners investigate the concept of humidity by using a dry and wet sponge as a model. They determine a model for 100% humidity, a sponge saturated with water.
Hot Stuff!: Investigation #1
Learners test two jars, one containing plain air and one containing carbon dioxide gas, to see their reactions to temperature changes.
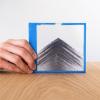
Avalanche
Source Institutions
In this geology activity, learners create a model using a mixture of salt and sand inside a CD case. When the case is tilted or inverted, the mixture dramatically sorts into a layered pattern.
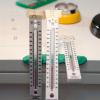
Hot Equator, Cold Poles
Source Institutions
In this activity, learners use multiple thermometers, placed at different angles, and a lamp to investigate why some places on Earth's surface are much hotter than others.

A Funny Taste
Source Institutions
In this activity, learners explore the different salinities of various sources of water by taste-testing.

How Much Water is in that Cloud?
Source Institutions
In this activity, learners working in pairs saturate a cotton ball using water drops from an eyedropper to demonstrate the high water capacity of clouds.

The Rumblin' Road: Determining distance to a Thunderstorm
Source Institutions
In this activity, learners discover how to determine the distance to a lightning strike or nearby thunderstorm.

Quadraphonic Wind
Source Institutions
In this activity, learners discover how the extent of various wind speeds changes in each of the four quadrants around a hurricane.

Good News: We're on the Rise!
Learners build a simple aneroid barometer to learn about changes in barometric pressure and weather forecasting. They observe their barometer and record data over a period of days.

Earth's Energy Cycle: Albedo
Source Institutions
In this activity, learners experiment and observe how the color of materials that cover the Earth affects the amounts of sunlight our planet absorbs.
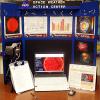
Space Weather Action Center
Source Institutions
In this interdisciplinary activity, learners create a Space Weather Action Center (SWAC) to monitor solar storms and develop real SWAC news reports.
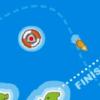
Cup Sailing Game
Source Institutions
In this online Flash game, learners will captain a sailing challenge, adjusting boat direction and sails, seeking the way to take greatest advantage of varying wind speeds and directions to catch the

Whose Fault Is It?
Source Institutions
In this seismic simulation, learners play a "who-dunnit" game to explore earthquakes.

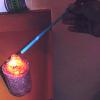
It's a Gas, Man
Source Institutions
In this activity, learners discover if carbon dioxide has an effect on temperature.
Coastal Erosion: Where's the Beach?
Source Institutions
Learners use beach profile data from a local beach or online data from Ocean City, Maryland to investigate coastal erosion and sediment transport.

Twirling in the Breeze
Source Institutions
In this engineering activity, learners build a device (an anemometer) to measure how fast the wind is blowing.
Sea State: Forecast Conditions at Sea
Source Institutions
In this oceanography and data collection activity, learners cast real time sea state conditions using buoys from NOAA's National Data Buoy Center.

Measure the Pressure: The "Wet" Barometer
Source Institutions
In this activity, learners use simple items to construct a device for indicating air pressure changes.
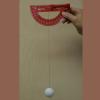
Measuring Wind Speed
Source Institutions
In this indoor and/or outdoor activity, learners make an anemometer (an instrument to measure wind speed) out of a protractor, a ping pong ball and a length of thread or fishing line.