Source Institutions
Source Institutions
Add to list Go to activity
Activity link broken? See if it's at the internet archive
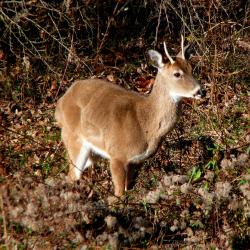
In this activity, learners model a population of deer and see how the number of deer changes over time. Learners investigate population change and graph the population over time to learn about how habitat availability affects populations. This activity works best outside.
- Under 5 minutes
- 10 to 30 minutes
- free per group of students
- Ages 11 - 18
- Activity, Game, Lesson/Lesson Plan, Simulation
- English
Quick Guide
Materials List (per group of students)
- A large area, preferably outside
Subjects
-
Life Sciences
-
Diversity of Life
- Animals
-
Ecology
- Ecosystems
- Populations
-
Diversity of Life
-
Mathematics
-
Data Analysis and Probability
- Data Collection
- Data Representation
-
Data Analysis and Probability
-
The Nature of Science
-
The Scientific Process
- Gathering Data
-
The Scientific Process
Informal Categories
- Animals
- Games
- Nature and Environment
- Outdoor Activity
- Physical Activity
Audience
To use this activity, learners need to:
- see
- read
- touch
Learning styles supported:
- Involves hands-on or lab activities
Other
Includes alignment to state and/or national standards:
Includes assesments for student learning:
This resource is part of:
Access Rights:
- Free access
By:
Rights:
- All rights reserved, ETV Commission, 2006