Source Institutions
Add to list Go to activity

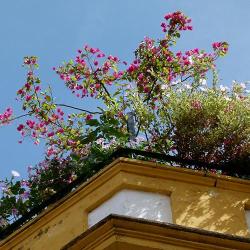
How does a green roof, or roof covered by plants, affect the temperature of the inside and outside of a building? Learners design and build houses to find out the answer. In doing so, they need to consider experimental design and controlling variables as well as cost constraints on building materials. Learners need to calculate surface area to calculate cost of materials. Learners then design an experiment and collect data to determine the effect of a green roof on a building. Time estimate for activity can be spread across multiple meetings.
- Under 5 minutes
- 1 to 2 hours
- $1 - $5 per group of students
- Ages 11 - 14
- Activity, Experiment/Lab Activity, Lesson/Lesson Plan, Model
- English
Quick Guide
Materials List (per group of students)
- foam core board or heavy cardboard (for creating two model buildings), ~15 x 20-inch [38 x 51-cm] sheet (which is half of the 30 x 40-in [~76 x 102-cm] size foam core board sheets typically available)
- 1-2 pieces of black tar paper, 6in x 6in [15 x 15-cm] (can use black construction paper)
- 1-2 pieces of sod (turf) and/or other sod or moss-like plants, 6in x 6in [15 x 15-cm] piece
- 1 piece of plastic sheeting, 30 x 30-cm; cut from plastic wrap or plastic trash bags
- duct tape
- hot glue gun (optional)
- X-ACTO knife, utility knife and/or scissors, to cut foam core board, black paper, sod, tape, etc.
- 2 thermometers (at least one long thermometer so you can access the interior of the model structures)
- 1 heat lamp
- 1 electric fan
- timer or stop watch
- paper
- pencils
- 4 sheets of graph paper
- (optional) soil (if not enough soil comes with sod)
- Materials and Cost Worksheet
- Temperature Data Sheet
- timer/stop watch (to synchronize students' time pieces; alternative idea: use a free online timer and project it in the room for all teams to see) (Optional)
- HOBO data logger with probe (available at electronics and hardware stores; this instrument records temperatures at set intervals over a period of time and creates data tables and graphs; usually requires a computer) (optional)
- laptop/desktop computer with LDC projector, Excel software, Internet access (optional)
Subjects
-
Earth and Space Science
-
Earth Structure
- Biosphere
-
Earth Structure
-
Engineering and Technology
-
Engineering
- Architectural Engineering
- Civil Engineering
-
Engineering
-
Mathematics
-
Algebra
- Equations and Inequalities
-
Data Analysis and Probability
- Data Analysis
- Data Collection
- Data Representation
-
Geometry
- Plane Geometry
-
Measurement
- Units of Measurement
-
Algebra
-
Physical Sciences
-
Heat and Thermodynamics
- Heat and Temperature
- Heat Transfer
-
Heat and Thermodynamics
-
The Nature of Science
-
The Scientific Process
- Asking Questions
- Conducting Investigations
- Gathering Data
-
The Scientific Process
-
The Nature of Technology
-
The Design Process
- Research and Development
- Invention and Innovation
- Problem Solving
- Troubleshooting and Maintenance
-
The Design Process
Informal Categories
- Gardening
- Model Building
Audience
To use this activity, learners need to:
- see
- read
- touch
Learning styles supported:
- Involves teamwork and communication skills
- Involves hands-on or lab activities
Other
Includes alignment to state and/or national standards:
This resource is part of:
Access Rights:
- Free access
By:
- Samson, Carleigh ; Rivale, Stephanie ; Carlson, Denise W.
Source Collection
- TeachEngineering
Rights:
- All rights reserved, Regents of the Univeristy of Colorado, 2009
