Source Institutions
Source Institutions
Add to list Go to activity
Activity link broken? See if it's at the internet archive

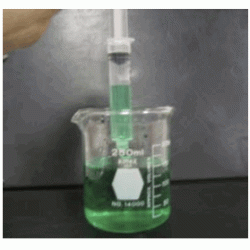
In this activity, learners explore Charles' Law in a syringe. Learners collect volume and temperature data for five different temperature samples, convert Celsius to Kelvin, and plot the data on a Cartesian graph to draw conclusions.
- Under 5 minutes
- 1 to 2 hours
- 1 cent - $1 per group of students
- Ages 14 - 18
- Activity, Experiment/Lab Activity, Lesson/Lesson Plan
- English
Quick Guide
Materials List (per group of students)
- plastic disposable syringe (5-10ml volumes work well)
- beakers or glass cups
- thermometer
- water
- calculator or microwave or heat block ice graph paper (optional) food coloring
- ice
- graph paper
- pen/pencil
- food coloring (optional)
Subjects
-
Earth and Space Science
-
Earth Structure
- Atmosphere
-
Earth Structure
-
Mathematics
-
Algebra
- Variables and Expressions
-
Data Analysis and Probability
- Data Analysis
- Data Collection
- Data Representation
-
Measurement
- Units of Measurement
- Rate
- Number and Operations
- Representation
-
Algebra
-
The Nature of Technology
-
The Design Process
- Problem Solving
-
The Design Process
-
Physical Sciences
-
Heat and Thermodynamics
- Heat and Temperature
-
States of Matter
- Gases
-
Structure and Properties of Matter
- Volume and Density
-
Heat and Thermodynamics
-
The Nature of Science
-
The Scientific Process
- Conducting Investigations
- Gathering Data
- Formulating Explanations
- Communicating Results
-
The Scientific Process
Audience
To use this activity, learners need to:
- see
- see color
- read
- touch
Learning styles supported:
- Involves teamwork and communication skills
- Involves hands-on or lab activities
Other
This resource is part of:
Access Rights:
- Free access
By:
- Yu, Julie
Rights:
- All rights reserved, Exploratorium, 2007
Funding Sources:
- National Science Foundation, 0610238
- National Science Foundation, 0925383
