Source Institutions
Source Institutions
Add to list Go to activity
Activity link broken? See if it's at the internet archive
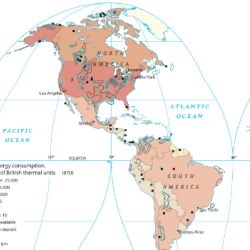
Learners explore the relationship between energy consumption, population, and carbon emissions in the countries of the Americas. As a large group, learners analyze maps projected on a screen to collect data. Then they work in small groups or individually to analyze the data and draw conclusions. Finally, learners create a large, wall-sized Americas Mega Map to display their findings.
- 10 to 30 minutes
- 45 to 60 minutes
- $1 - $5 per group of students
- Ages 14 - 18
- Activity, Lesson/Lesson Plan
- English
Quick Guide
Materials List (per group of students)
- Americas Mega Map (assemble before activity)
- pencils
- pens
- construction paper
- markers
- scissors
- computer, flash enabled and internet access
- projector
- worksheet-Determine Energy Consumption and Carbon Emissions (1 per learner)
Subjects
-
Life Sciences
-
Ecology
- Populations
- Human Impact
-
Ecology
-
Mathematics
-
Data Analysis and Probability
- Data Analysis
- Data Collection
- Data Representation
-
Measurement
- Size and Scale
-
Data Analysis and Probability
-
The Nature of Science
-
The Scientific Process
- Conducting Investigations
- Gathering Data
- Communicating Results
-
The Scientific Process
Informal Categories
- Nature and Environment
Audience
To use this activity, learners need to:
- see
- see color
- read
- touch
Learning styles supported:
- Involves teamwork and communication skills
- Involves hands-on or lab activities
Other
Components that are part of this resource:
Includes alignment to state and/or national standards:
- National Council for Social Studies Curriculum Standards - Themes 3 and 7
- National Geography Standards - Standards 1 and 11
This resource is part of:
Access Rights:
- Free access
By:
- Barry, Sharon L. ; Hulse, Kim
Rights:
- All rights reserved, National Geographic Society, 2008