Search Results
Showing results 1 to 16 of 16
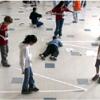
FlyBy Math: Distance-Rate-Time Problems in Air Traffic Control
Source Institutions
In this small-group activity, learners assume the roles of pilots, air traffic controllers, and NASA scientists to solve five Air Traffic Control (ATC) problems.

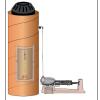
Pollution Patrol
Source Institutions
In this activity, learners explore how engineers design devices that can detect the presence of pollutants in the air.

Hot Air
Source Institutions
In this activity, learners set up an experiment to investigate the effects of hot air on the path of a laser beam.

Percentage of Oxygen in the Air
Source Institutions
In this activity, learners calculate the percentage of oxygen in the atmosphere by using steel wool's ability to rust.

Heat Capacity: Can't Take the Heat?
Source Institutions
Why is ocean water sometimes the warmest when the average daily air temperature starts to drop? In this activity, learners explore the differing heat capacities of water and air using real data.
Rocket Wind Tunnel
Source Institutions
In this activity, learners evaluate the potential performance of air rockets placed inside a wind tunnel.

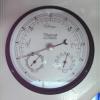
Measure the Pressure: The "Wet" Barometer
Source Institutions
In this activity, learners use simple items to construct a device for indicating air pressure changes.

Measure the Pressure II: The "Dry" Barometer
Source Institutions
In this activity, learners use simple items to construct a device for indicating air pressure changes.
Air Pressure and Dent Pullers
Source Institutions
In this activity, learners simulate Otto von Guericke's famous Magdeburg Hemispheres experiment.

Mold Mole Molds
Source Institutions
In this activity, learners make different shapes that hold exactly one mole of gas (air).

Drawing Conclusions
Source Institutions
In this weather forecasting activity, learners determine the location of cold and warm fronts on weather plot maps.
Make Your Own Barometer
Source Institutions
In this weather activity (page 10 of the PDF), learners will demonstrate the changes in atmospheric pressure by constructing their own barometer.
Haunted by Hurricanes: Use Data to Learn About Hurricanes
Source Institutions
In this activity, learners will determine if the frequency and intensity of hurricanes are changing using real data from the National Hurricane Center.
Sizing Up Temperature
Source Institutions
In this activity, learners explore Charles' Law in a syringe.
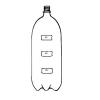
Under Pressure
Source Institutions
In this experiment, learners examine how pressure affects water flow. In small groups, learners work with water and a soda bottle, and then relate their findings to pressure in the deep ocean.
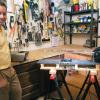
Model Wind Tunnel
Source Institutions
In this activity, learners build a miniature wind tunnel to measure force. Learners construct the model out of Lexan plastic, a fan, and a precise digital scale.