Search Results
Showing results 1 to 7 of 7

Heat Capacity: Can't Take the Heat?
Source Institutions
Why is ocean water sometimes the warmest when the average daily air temperature starts to drop? In this activity, learners explore the differing heat capacities of water and air using real data.
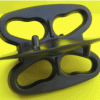
Air Pressure and Dent Pullers
Source Institutions
In this activity, learners simulate Otto von Guericke's famous Magdeburg Hemispheres experiment.

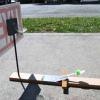
Paper Drop Design Competition
Source Institutions
Using paper, paper clips, an index card, and tape, teams of learners design flying devices to (1) stay in the air as long as possible and (2) land as close as possible to a given target.
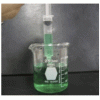
Sizing Up Temperature
Source Institutions
In this activity, learners explore Charles' Law in a syringe.
Parabola Basketball
Source Institutions
In this activity, learners build mini-basketball courts and explore the laws of physics. Learners discover that everything you throw or shoot on earth travels in a parabola.

The Daily Ups and Downs
Source Institutions
In this activity, learners graph 48 hourly air temperatures from a local weather observation site and observe the diurnal temperature variations.

Make Your Own Weather Station
Source Institutions
This three-part activity shows learners how to build three meteorology tools: a wind vane, a rain gauge, and a barometer.