Search Results
Showing results 1 to 20 of 23

Heat Capacity: Can't Take the Heat?
Source Institutions
Why is ocean water sometimes the warmest when the average daily air temperature starts to drop? In this activity, learners explore the differing heat capacities of water and air using real data.

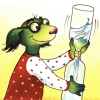
Dripping Wet or Dry as a Bone?
Learners investigate the concept of humidity by using a dry and wet sponge as a model. They determine a model for 100% humidity, a sponge saturated with water.

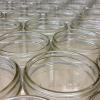
Hot Stuff!: Investigation #1
Learners test two jars, one containing plain air and one containing carbon dioxide gas, to see their reactions to temperature changes.

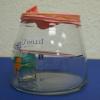
Measure the Pressure: The "Wet" Barometer
Source Institutions
In this activity, learners use simple items to construct a device for indicating air pressure changes.

Measure the Pressure II: The "Dry" Barometer
Source Institutions
In this activity, learners use simple items to construct a device for indicating air pressure changes.

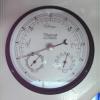
Good News: We're on the Rise!
Learners build a simple aneroid barometer to learn about changes in barometric pressure and weather forecasting. They observe their barometer and record data over a period of days.
Hot Stuff!: Investigation #4
Learners test two jars containing soil, one covered and one open, for changes in temperature. After placing the jars in the Sun, learners discover that the covered jar cools down more slowly.

Hot Stuff!: Investigation #2
Learners test two jars containing hot water, one covered with plastic and one open, for changes in temperature.
Hot Stuff!: Investigation #3
Learners test two jars of ice water, one covered and one open, for changes in temperature. After placing the jars in the sun, learners discover that the covered jar cools down more slowly.

Drawing Conclusions
Source Institutions
In this weather forecasting activity, learners determine the location of cold and warm fronts on weather plot maps.

Wind Power: Creating a Wind Generator
Source Institutions
This lesson challenges groups of learners to design and construct a wind generator with the most electrical output.
Twist and Spout
Source Institutions
In this activity, learners make their own "tornado" using two soda bottles and water.
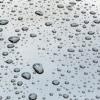
Why do Raindrops Sometimes Land Gently and Sometimes Land with a Splat?
Source Institutions
In this activity, learners examine raindrop bottles (prepared ahead of time) to observe in slow motion the behavior of falling droplets and explore concepts such as drag and terminal velocity.

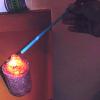
The Rumblin' Road: Determining distance to a Thunderstorm
Source Institutions
In this activity, learners discover how to determine the distance to a lightning strike or nearby thunderstorm.
Design and Build a Barometer
Source Institutions
In this activity, learners make a barometer, an instrument to measure change in air pressure.
Make Your Own Barometer
Source Institutions
In this weather activity (page 10 of the PDF), learners will demonstrate the changes in atmospheric pressure by constructing their own barometer.
Atmospheric Collisions
Source Institutions
In this activity/demonstration, learners observe what happens when two ping pong balls are suspended in the air by a hair dryer. Use this activity to demonstrate how rain drops grow by coalescence.
Haunted by Hurricanes: Use Data to Learn About Hurricanes
Source Institutions
In this activity, learners will determine if the frequency and intensity of hurricanes are changing using real data from the National Hurricane Center.
Let's Dew It!
Source Institutions
From the Weather Watchers featured theme on the CYBERCHASE website. Learners will conduct experiments to discover how air temperature and humidity work together to make condensation, dew, and fog.
Cup Sailing Game
Source Institutions
In this online Flash game, learners will captain a sailing challenge, adjusting boat direction and sails, seeking the way to take greatest advantage of varying wind speeds and directions to catch the