Search Results
Showing results 1 to 20 of 20
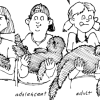
Otter Smorgasbord
Source Institutions
In this graphing activity (on pages 33-40), learners investigate how much and what kinds of food sea otter pups eat during their first year of life.
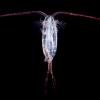
Plankton Feeding
Source Institutions
This activity provides a hands-on experience with a scale model, a relatively high viscosity fluid, and feeding behaviors.
Do Plants Need Light?
Source Institutions
In this food science activity, learners conduct an experiment that demonstrates the importance of light to plants.
Bury Me Not!
Source Institutions
This activity (page 2 of the PDF under SciGirls Activity: Bogs) is a full inquiry investigation into decomposition.

What's the Difference between Weather and Climate?
Source Institutions
In this interactive and informative group activity, learners use packages of M&M's to illustrate the difference between weather and climate.
Amphibian Skin
Source Institutions
In this activity, learners explore the concept of permeability to better understand why amphibians are extremely sensitive to pollution.
Measuring and Protecting Skin
Source Institutions
In this activity, learners compare and contrast their own skin (including the area covered) with that of an orange.
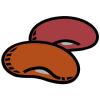
Not Just A Bag Of Beans
Source Institutions
In this activity, learners count and measure kidney beans to explore natural selection and variation. Learners measure the length of 50-100 beans.

A Funny Taste
Source Institutions
In this activity, learners explore the different salinities of various sources of water by taste-testing.

Statistics: Something Fishy
Source Institutions
In this math lesson, learners apply the concepts of ratio and proportion to the capture-recapture statistical procedure.

Avogadro's Bubbly Adventure
Source Institutions
In this activity on page 7 of the PDF, learners investigate the solubility of gas in water at different temperatures. This experiment will help learners determine if temperature affects solubility.

Chilean Sea Bass: Off the Menu
Source Institutions
In this data analysis activity, learners use data collected by the Commission for the Conservation of Antarctic Marine Living Resources (CCAMLR) to study Chilean sea bass populations.
Harmful Algal Blooms: In Full Bloom
Source Institutions
In this activity, learners will investigate the impacts of harmful phytoplankton using NOAA's Coastal Services Center Harmful Algal Bloom Forecasting (HABF) Project data.
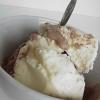
We all Scream for Ice Cream
Source Institutions
In this activity, learners observe how salinity affects the freezing point of water by making and enjoying ice cream.
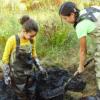
Trash Talkin'
In this activity, learners collect, categorize, weigh and analyze classroom trash and discuss ways that engineers have helped to reduce solid waste.
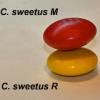
Survival of the Fittest: Variations in the Clam Species Clamys sweetus
Source Institutions
This guided inquiry three-part activity engages learners in thinking about the mechanism of natural selection by encouraging them to formulate questions that can be answered through scientific investi
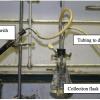
Investigating and Using Biomass Gases
Source Institutions
In this activity, learners will be introduced to biomass gasification and will generate their own biomass gases.
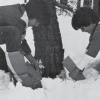
Wintergreen
Source Institutions
In this outdoor, winter activity, learners find living green plants under the snow and determine the light and temperature conditions around the plants.
Survival of the Fittest: Battling Beetles
Source Institutions
This guided inquiry three-part activity engages learners in thinking about the mechanism of natural selection through data collection and pattern recognition.

Mapping Sea Level Rise
Source Institutions
In this activity related to climate change, learners create and explore topographical maps as a means of studying sea level rise.