Search Results
Showing results 1 to 8 of 8
Fuel for Living Things
Source Institutions
In this activity, learners observe what happens when yeast cells are provided with a source of food (sugar). Red cabbage "juice" will serve as an indicator for the presence of carbon dioxide.
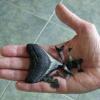
Chomp
Source Institutions
In this activity (page 5 of pdf), learners explore the relationships between the shape and structure of a shark's teeth and the food it eats, and then create their own shark tooth from clay.
How Does Water Climb a Tree?
Source Institutions
In this activity, learners conduct an experiment to explore how water flows up from a tree's roots to its leafy crown.

Exponential Models: Rhinos and M&M’s ®
Source Institutions
In this math lesson, learners model exponential decay and exponential growth using M&M's, paper folding, and African rhino population data.
Measuring and Protecting Skin
Source Institutions
In this activity, learners compare and contrast their own skin (including the area covered) with that of an orange.

The Scoop on Scallops
Source Institutions
In this data analysis activity, learners quantify the abundance and distribution of sea scallops in and adjacent to the Mid-Atlantic closed areas.

Chilean Sea Bass: Off the Menu
Source Institutions
In this data analysis activity, learners use data collected by the Commission for the Conservation of Antarctic Marine Living Resources (CCAMLR) to study Chilean sea bass populations.
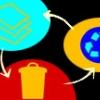
Trash Talkin'
In this activity, learners collect, categorize, weigh and analyze classroom trash and discuss ways that engineers have helped to reduce solid waste.