Search Results
Showing results 1 to 10 of 10
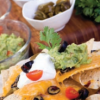
The Menu Game at the Terribly Terrific Taco
Source Institutions
In this math game (Page 15 of the Dining Out! PDF), learners figure discounts and/or profit increases for various food totals. Learners add decimals to $100.
Dunking the Planets
Source Institutions
In this demonstration, learners compare the relative sizes and masses of scale models of the planets as represented by fruits and other foods.
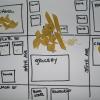
Create a Pasta Population Map
Source Institutions
Learners work as a group to create a map of their community. They use pasta to represent people, and glue the pasta on their maps to show areas of large population.
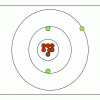
M&M® Model of the Atom: Edible Subatomic Particles
Source Institutions
In this activity, learners use colored candy to represent subatomic particles and make a model of an atom (Bohr model).

Fraction Penguin
Source Institutions
In this craft activity, learners will recognize, name, and compare the fractions 1/2, 1/4, and 1/8 by constructing a penguin out of portions of paper circles.

The Snack Shop
Source Institutions
In this math activity (Page 11 of the Dining Out! PDF), younger learners count out the total amount of money needed to purchase trail mix using the fewest number of bills/coins possible.
Joe's Place
Source Institutions
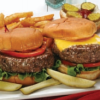
In this math activity (Page 8 of the Dining Out! PDF), younger learners select items from a menu and count out the total amount needed using the fewest bills and coins possible.
Cookie Surface Area
Source Institutions
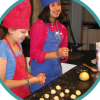
This is an activity (on page 2 of the PDF under Surface Area Activity) about surface area to volume ratio.
Eatem Up
Source Institutions
In this math activity, learners use gingerbread cookies to collect and organize simple data. First, learners read "The Gingerbread Boy" by Paul Galdone.
Plenty on the Plains
Source Institutions
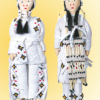
In this activity, learners compare the ways of life of Plains Native Americans who hunted and moved frequently to follow the buffalo herds, and Native Americans who farmed and lived in more permanent
