Search Results
Showing results 61 to 80 of 134

It's the "Rain," Man
Source Institutions
In this weather forecasting activity, learners use common materials to construct a rain gauge and measure daily, monthly, and yearly rainfall.
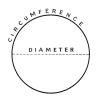
Pi Graph
Source Institutions
In this activity, learners use a straight line to learn about circles. Learners measure and record the diameter and circumference of different sized cylindrical objects on a chart.
Glaciers
Source Institutions
In this online activity, learners adjust mountain snowfall and temperature to see how glaciers grow and shrink. They will use scientific tools to measure thickness, velocity and glacial budget.
Meteoroids and the Craters They Make
Source Institutions
In this activity, learners investigate the formation of craters. Learners will examine how the size, angle and speed of a meteorite's impact affects the properties of craters.
Ramps 1: Let it Roll!
Source Institutions
In this activity about ramps, learners explore and measure the rate at which spherical objects roll down a ramp.

Mold Growth
Source Institutions
In this activity learners observe mold growth on different types of bread by measuring and recording the growth rate.
Finding the Size of the Sun and Moon
Source Institutions
In this activity, learners build a simple pinhole viewer. They use this apparatus to project images from a variety of light sources, including a candle, the Sun, and the Moon.
Change in Temperature: Endothermic Reaction
Source Institutions
Learners investigate signs of a chemical reaction when they mix vinegar and baking soda. In addition to a gas being produced, learners also notice the temperature decreases.
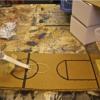
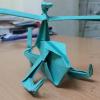
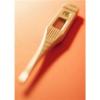
Finger Basketball
Source Institutions
In this activity, learners build mini-basketball courts using cardboard and measuring spoons. Use this activity to introduce learners to catapults, forces, and levers.
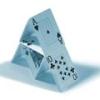
Critical Load
Source Institutions
In this activity, learners explore the concepts of structural engineering and how to measure the critical load, or the maximum weight a structure can bear.

Percentage of Oxygen in the Air
Source Institutions
In this activity, learners calculate the percentage of oxygen in the atmosphere by using steel wool's ability to rust.
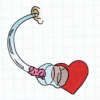
Heart to Heart
Source Institutions
In this activity, learners compare ways to measure their heart rates. Learners build their own stethoscopes and learn how exercise affects heart rate.
Chew that Gum
Source Institutions
In this quick activity (page 1 of PDF under SciGirls Activity: Exercise and Memory), learners will investigate what happens to bubble gum when it is chewed for 5-10 minutes.
Relative Speed of Dinosaurs
Source Institutions
In this activity, learners interpret three trackways and use measurements and a formula to infer the relative speed of dinosaurs.

Earth Atmosphere Composition
Source Institutions
In this activity, learners use rice grains to model the composition of the atmosphere of the Earth today and in 1880. Learners assemble the model while measuring percentages.
The Ups and Downs of Body Temperature
Source Institutions
In this activity (1st on the page), learners explore circadian rhythms by keeping track of their body temperature.
Cool It!
Source Institutions
In this fun hands-on activity, learners use simple materials to investigate evaporation. How can the evaporation of water on a hot day be used to cool an object? Find out the experimental way!
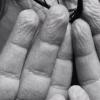
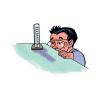
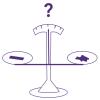
Test the Finger Wrinkle Hypothesis
Source Institutions
Learners create a tool to measure how well they grip a wet object when their fingers are smooth versus wrinkly. Are smooth or wrinkly fingers better at holding on to the object?