Search Results
Showing results 1 to 8 of 8
Sea State: Forecast Conditions at Sea
Source Institutions
In this oceanography and data collection activity, learners cast real time sea state conditions using buoys from NOAA's National Data Buoy Center.
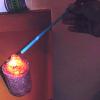
Colors of Stars
Source Institutions
In this activity, learners observe colors in the flame of a burning candle to explore connections between matter, light, color and temperature -- basic concepts of matter and energy.
Hot Stuff!: Investigation #4
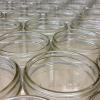
Learners test two jars containing soil, one covered and one open, for changes in temperature. After placing the jars in the Sun, learners discover that the covered jar cools down more slowly.
Light on Other Planets
Source Institutions
In this math-based activity, learners model the intensity of light at various distances from a light source, and understand how astronomers measure the amount of sunlight that hits our planet and othe

Hot Stuff!: Investigation #2
Learners test two jars containing hot water, one covered with plastic and one open, for changes in temperature.
Hot Stuff!: Investigation #3
Learners test two jars of ice water, one covered and one open, for changes in temperature. After placing the jars in the sun, learners discover that the covered jar cools down more slowly.

Hot Stuff!: Investigation #1
Learners test two jars, one containing plain air and one containing carbon dioxide gas, to see their reactions to temperature changes.

Avogadro's Bubbly Adventure
Source Institutions
In this activity on page 7 of the PDF, learners investigate the solubility of gas in water at different temperatures. This experiment will help learners determine if temperature affects solubility.