Search Results
Showing results 1 to 16 of 16

Heat Capacity: Can't Take the Heat?
Source Institutions
Why is ocean water sometimes the warmest when the average daily air temperature starts to drop? In this activity, learners explore the differing heat capacities of water and air using real data.
Determining the Amount of Transpiration from a Schoolyard Tree
Source Institutions
In this activity, learners calculate the number of milliliters of water a nearby tree transpires per day.
Toast a Mole!
Source Institutions
In this quick activity, learners drink Avogadro's number worth of molecules - 6.02x10^23 molecules!
The Ballistic Pendulum
Source Institutions
In this physics crime lab or demonstration, learners pretend they are criminologists and must find the "muzzle velocity" (speed of the bullet as it leaves the gun) of a gun used to commit a crime.
Gummy Growth
Source Institutions
In this activity related to Archimedes' Principle, learners use water displacement to compare the volume of an expanded gummy bear with a gummy bear in its original condition.
How Big is Small
Source Institutions
In this classic hands-on activity, learners estimate the length of a molecule by floating a fatty acid (oleic acid) on water.

The Dead Zone: A Marine Horror Story
Source Institutions
In this environmental science and data analysis activity, learners work in groups to track a Dead Zone (decreased dissolved oxygen content of a body of water) using water quality data from the Nutrien
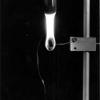
Burn a Peanut
Source Institutions
In this activity, learners burn a peanut, which produces a flame that can be used to boil away water and count the calories contained in the peanut.

A Cubic Foot Per Second
Source Institutions
In this activity, learners measure and calculate the amount of cubic feet various containers contain. Next, learners investigate cubic feet per second (cps), by carrying jugs in one second.

Earth Atmosphere Composition
Source Institutions
In this activity, learners use rice grains to model the composition of the atmosphere of the Earth today and in 1880. Learners assemble the model while measuring percentages.
Mass of the Earth
Source Institutions
In this activity, learners use basic measurements of the Earth and pieces of rock and iron to estimate the mass of the Earth.
Launch Altitude Tracker
Source Institutions
In this activity, learners construct hand-held altitude trackers. The device is a sighting tube with a marked water level that permits measurement of the inclination of the tube.
The Blue Crab's Chesapeake Journey
Source Institutions
In this data collection activity about crabs, learners use data from the Virginia Institute of Marine Science (VIMS) trawl survey to determine the areas of the Chesapeake Bay that are being used by bl

Sustainable Grazing
Source Institutions
In this activity, learners investigate the food, water, and space needs of common livestock animals.
Fish Eyes: More than Meets the Eye
Source Institutions
In this data collection and analysis activity, learners evaluate fish physiology and ecology using vision research data from Dr.

Arctic Sea Ice
Source Institutions
In this activity, learners explore how the area of Arctic sea ice has changed over recent years. First, learners graph the area of Arctic sea ice over time from 1979 to 2007.