Search Results
Showing results 1 to 12 of 12

Heat Capacity: Can't Take the Heat?
Source Institutions
Why is ocean water sometimes the warmest when the average daily air temperature starts to drop? In this activity, learners explore the differing heat capacities of water and air using real data.
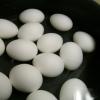
Salt 'n Lighter
Source Institutions
In this activity, learners discover that as the salinity of water increases, the density increases as well. Learners prove this by attempting to float fresh eggs in saltwater and freshwater.

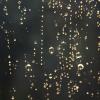
How Much Water is in that Cloud?
Source Institutions
In this activity, learners working in pairs saturate a cotton ball using water drops from an eyedropper to demonstrate the high water capacity of clouds.
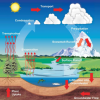
The Rain Man
Source Institutions
In this activity, learners observe the hydrologic cycle in action as water evaporates and condenses to form rain right before their eyes.
Weather Stations: Phase Change
Source Institutions
In this activity, learners observe the water cycle in action! Water vapor in a tumbler condenses on chilled aluminum foil — producing the liquid form of water familiar to us as rain and dew.
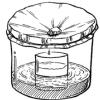
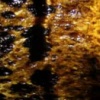
Rain Machine (Solar Still)
Source Institutions
In this activity, learners work in groups to build simple solar stills filled with salt water. After the stills are complete, learners observe what happens when they place the stills in the sun.
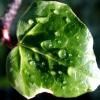
Leaf it to Me
Source Institutions
In this activity, learners observe the effect of transpiration as water is moved from the ground to the atmosphere.

That Sinking Feeling
Source Institutions
In this quick activity, learners observe how salinity and temperature affect the density of water, to better understand the Great Ocean Conveyor.
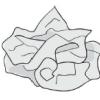
Crumple a Watershed
Source Institutions
Learners gain an intuitive knowledge of the physical aspects of watersheds by creating their own watershed models.
Amphibian Skin
Source Institutions
In this activity, learners explore the concept of permeability to better understand why amphibians are extremely sensitive to pollution.
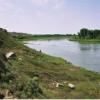
Mystery of the Disappearing Cottonwoods
Source Institutions
Learners will explore the scientific mystery behind a disappearing group of trees by examining data and attempting to explain the decline.

It's a Gas, Man
Source Institutions
In this activity, learners discover if carbon dioxide has an effect on temperature.