Search Results
Showing results 41 to 60 of 70
The Dead Zone: A Marine Horror Story
Source Institutions
In this environmental science and data analysis activity, learners work in groups to track a Dead Zone (decreased dissolved oxygen content of a body of water) using water quality data from the Nutrien
Wave on Wave
Source Institutions
In this activity, learners use raisins and seltzer water to understand why waves don’t move objects forward. Learners conduct two simple experiments to understand the circular movement of waves.

A Cubic Foot Per Second
Source Institutions
In this activity, learners measure and calculate the amount of cubic feet various containers contain. Next, learners investigate cubic feet per second (cps), by carrying jugs in one second.
Earth Atmosphere Composition
Source Institutions
In this activity, learners use rice grains to model the composition of the atmosphere of the Earth today and in 1880. Learners assemble the model while measuring percentages.

Mass of the Earth
Source Institutions
In this activity, learners use basic measurements of the Earth and pieces of rock and iron to estimate the mass of the Earth.
Amphibian Skin
Source Institutions
In this activity, learners explore the concept of permeability to better understand why amphibians are extremely sensitive to pollution.
River Catcher
Source Institutions
In this activity (located at the top of the page), learners make an easy river strainer and see what they can catch.
Weather Stations: Storms
Source Institutions
In this activity, learners test how cornstarch and glitter in water move when disturbed. Learners compare their observations with videos of Jupiter's and Earth's storm movements.
Plankton Feeding
Source Institutions
This activity provides a hands-on experience with a scale model, a relatively high viscosity fluid, and feeding behaviors.
Counting With Quadrants
Source Institutions
Millions of organisms can live in and around a body of water.

Floodplain Modeling
In this design-based lesson, learners study flood dynamics as they modify a riverbed with blockages or levees to simulate real-world scenarios.
Sea Level: On The Rise
Source Institutions
Learners will understand the relationship between climate change and sea-level rise.
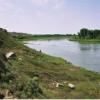
Mystery of the Disappearing Cottonwoods
Source Institutions
Learners will explore the scientific mystery behind a disappearing group of trees by examining data and attempting to explain the decline.
Malformed Frogs
Source Institutions
This activity (on page 2 of the PDF under SciGirls Activity: Malformed Frogs) is a full inquiry investigation into using indicator species to assess the health of an environment.
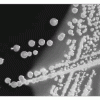
Microbes are Everywhere
Source Institutions
In this four-day activity, learners grow bacteria and/or fungi from a variety of locations and compare the results.
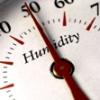
Making Sense of Sensors
Source Institutions
In this activity, learners explore sensors and focus specifically on how to measure humidity using a sensor.
It's a Gas, Man
Source Institutions
In this activity, learners discover if carbon dioxide has an effect on temperature.

Monitoring Amphibians
Source Institutions
In this field study, learners discover how to collect data in the field and how their efforts can help certain animals, specifically, amphibians.
The Blue Crab's Chesapeake Journey
Source Institutions
In this data collection activity about crabs, learners use data from the Virginia Institute of Marine Science (VIMS) trawl survey to determine the areas of the Chesapeake Bay that are being used by bl

Avogadro's Bubbly Adventure
Source Institutions
In this activity on page 7 of the PDF, learners investigate the solubility of gas in water at different temperatures. This experiment will help learners determine if temperature affects solubility.
