Search Results
Showing results 1 to 19 of 19

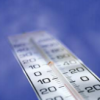
The Daily Ups and Downs
Source Institutions
In this activity, learners graph 48 hourly air temperatures from a local weather observation site and observe the diurnal temperature variations.

Forward Thinking
Source Institutions
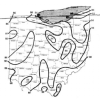
In this activity, learners create their own weather forecast map.

If Anyone Can, Icon
Source Institutions
In this activity, learners create their own icons for a forecast-at-a-glance poster for their classroom/learning space.

Drawing Conclusions
Source Institutions
In this weather forecasting activity, learners determine the location of cold and warm fronts on weather plot maps.
Water Cycle in a Bag
Source Institutions
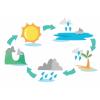
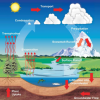
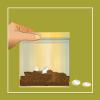
In this activity, learners will explore the water cycle by creating a small atmosphere.
Wonderful Weather
Source Institutions
In this activity, learners conduct three experiments to examine temperature, the different stages of the water cycle, and how convection creates wind.
Weather Stations: Winds
Source Institutions
In this activity, learners use a toaster to generate wind and compare the appliance's heat source to Jupiter's own hot interior. Learners discover that convection drives wind on Jupiter and on Earth.
The Crayon Rock Cycle
Source Institutions
In this activity, learners use crayons to draw conclusions about rocks and the rock cycle.
Weather Stations: Phase Change
Source Institutions
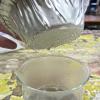
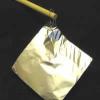
In this activity, learners observe the water cycle in action! Water vapor in a tumbler condenses on chilled aluminum foil — producing the liquid form of water familiar to us as rain and dew.
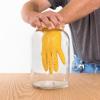
Fog Chamber
Source Institutions
In this weather-related activity, learners make a portable cloud in a bottle.
Weather Stations: Temperature and Pressure
Source Institutions
In this activity, learners discover the relationship between temperature and pressure in the lower atmospheres of Jupiter and Earth.

A Degrading Experience
Source Institutions
In this activity on page 27, learners perform an experiment to learn about how different types of marine debris degrade and how weather and sunlight affect the rate of degradation.
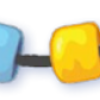
Make a Water Cycle Wristband
Source Institutions
In this activity, learners thread colored beads onto string. Each beach represent a process of the water cycle.

The Rumblin' Road: Determining distance to a Thunderstorm
Source Institutions
In this activity, learners discover how to determine the distance to a lightning strike or nearby thunderstorm.
How is Coastal Temperature Influenced by the Great Lakes and the Ocean?
Source Institutions
In this two-part lesson, learners discover how large bodies of water can serve as a heat source or sink at different times and how proximity to water moderates climate along the coast.
Water Cycle in a Bag
Source Institutions
In this activity, learners create a biosphere in a baggie.
The Carbon Cycle: How It Works
Source Institutions
In this game, learners walk through an imaginary Carbon Cycle and explore the ways in which carbon is stored in reservoirs and the processes that transport the carbon atom from one location to another
The Return of El Nino
Source Institutions
In this activity related to climate change and data analysis, learners examine temperature and precipitation data to determine if climate variations are due to El Niño.
We all Scream for Ice Cream
Source Institutions
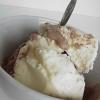
In this activity, learners observe how salinity affects the freezing point of water by making and enjoying ice cream.