Search Results
Showing results 1 to 20 of 41
Hold a Hill
Source Institutions
In this outdoor activity, learners investigate the relationship between the slope of a trail and soil erosion.
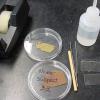
Investigating Density Currents
Source Institutions
In this lab activity, learners explore how to initiate a density current. Learners measure six flasks with different concentrations of salt and water (colored blue).
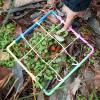
Counting With Quadrants
Source Institutions
Millions of organisms can live in and around a body of water.
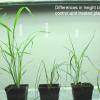
Effect of Environment on Plant Growth
Source Institutions
The purpose of this plant biotechnology activity is to demonstrate the effect of changes in the environment on the growth and fertility of landscape grasses and crop grasses such as wheat and rice.

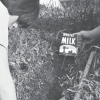
A Cubic Foot Per Second
Source Institutions
In this activity, learners measure and calculate the amount of cubic feet various containers contain. Next, learners investigate cubic feet per second (cps), by carrying jugs in one second.

Arctic Sea Ice
Source Institutions
In this activity, learners explore how the area of Arctic sea ice has changed over recent years. First, learners graph the area of Arctic sea ice over time from 1979 to 2007.
Coastal Erosion: Where's the Beach?
Source Institutions
Learners use beach profile data from a local beach or online data from Ocean City, Maryland to investigate coastal erosion and sediment transport.
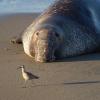
Natural Selection in Protected and Unprotected Populations
Source Institutions
In this simulation, learners model two elephant seal populations and how they change over time. Learners start with cards representing a variety of seals.
Measuring Biodiversity
Source Institutions
Learners use a variety of beans to represent a variety of species, and scatter these beans over a large piece of paper representing the environment.
Understanding Albedo
Source Institutions
In this activity related to climate change, learners examine albedo and the ice albedo feedback effect as it relates to snow, ice, and the likely results of reduced snow and ice cover on global temper

Mapping Sea Level Rise
Source Institutions
In this activity related to climate change, learners create and explore topographical maps as a means of studying sea level rise.
Earth Walk
Source Institutions
In this hands-on and feet-on excursion, learners take a science walk to visualize the planet's immense size and numerous structures, without the usual scale and ratio dimensions found in most textbook
Clipbirds
Source Institutions
In this simulation of natural selection, learners use binder clips in three different sizes to represent the diversity of beak sizes in a bird population.

Coral Snapshots: Biodiversity in Marine Protected Areas
Source Institutions
In this data activity, learners analyze data from coral reef snapshots taken by scientists at the Virginia Institute of Marine Science.
To Topo Two
Source Institutions
In this activity, two groups of learners create two separate landform models out of clay (mountains and valleys).
Personal Time Line
Source Institutions
In this activity, learners work in groups to create a time line representing significant moments in their lives.
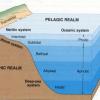
Introduction to Ocean Zones
Source Institutions
In this activity, learners will create a diagram of the ocean zones and determine what organisms live in each zone.
Crime Scene Investigation (CSI) with Powdery Mildew Fungi
Source Institutions
This exercise can be used to stimulate the investigative nature of learners as they use forensic plant pathology techniques to prove the learners' innocence in a mock murder investigation.
What's the Angle?
Source Institutions
This activity helps learners understand how the angle of the Sun affects temperatures around the globe.
Diatom Ooze: Ooze Clues
Source Institutions
In this activity, learners will plot the distribution of various oozes using information from sediment maps.