Search Results
Showing results 1 to 13 of 13
Plot the Dot: A Graphical Approach to Density
Source Institutions
In this activity, learners work in groups to determine the mass and volume of four samples: glass marbles, steel washers or nuts, pieces of pine wood, and pieces of PVC pipe.
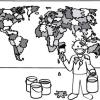
The Poor Cartographer: Graph Coloring
Source Institutions
In this activity, learners help a poor cartographer color in the countries on a map, making sure each country is colored a different color than any of its neighbors.
Paper Tape Motion Timer
Source Institutions
In this activity, learners build a recording timer made from simple materials (e.g., small dc motor, sharpie pen, craft sticks, adding machine paper tape, etc.).
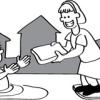
The Muddy City: Minimal Spanning Trees
Source Institutions
In this puzzle, learners investigate the decisions involved in linking a network between houses in a muddy city.

Pi Toss
Source Institutions
In this activity, learners explore a surprising method for calculating the mathematical constant pi, known as Buffon's Needle.
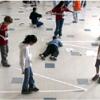
FlyBy Math: Distance-Rate-Time Problems in Air Traffic Control
Source Institutions
In this small-group activity, learners assume the roles of pilots, air traffic controllers, and NASA scientists to solve five Air Traffic Control (ATC) problems.
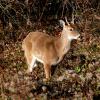
Population Study Game: Oh, Deer!
Source Institutions
In this activity, learners model a population of deer and see how the number of deer changes over time.
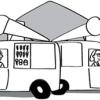
Transit Tracks
Source Institutions
In this space science activity, learners explore transits and the conditions when a transit may be seen.
Tourist Town: Dominating Sets
Source Institutions
In this activity, learners use a fictitious map of "Tourist Town" and counters to problem solve how to place ice-cream vans on street intersections so that every other intersection is connected to one
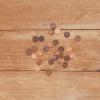
Radioactive-Decay Model: Substitute coins for radiation
Source Institutions
Get a roll of pennies, throw them on the ground, then remove those that only show tails, and repeat with the ones left over.

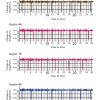
Arctic Sea Ice
Source Institutions
In this activity, learners explore how the area of Arctic sea ice has changed over recent years. First, learners graph the area of Arctic sea ice over time from 1979 to 2007.
Graph Dance
Source Institutions
In this activity, learners "dance" (move back and forth at varying speeds) by reading a graph. This is a kinesthetic way to help learners interpret and understand how motion is graphed.
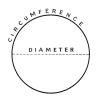
Pi Graph
Source Institutions
In this activity, learners use a straight line to learn about circles. Learners measure and record the diameter and circumference of different sized cylindrical objects on a chart.