Search Results
Showing results 21 to 40 of 47
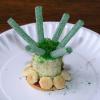
Build a Coral Polyp
Source Institutions
In this activity, learners build one or more edible coral polyps and place them together to form a colony.
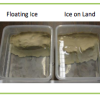
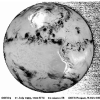
Sea Level: On The Rise
Source Institutions
Learners will understand the relationship between climate change and sea-level rise.
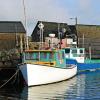
Sustainable Fishing
Source Institutions
In this activity, learners use a model for how fishing affects marine life populations, and will construct explanations for one of the reasons why fish populations are declining.
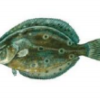
Ocean Home: Swimming Fishes
Source Institutions
In this activity, learners model, on a human-sized board game, how changes in water temperature may affect fish distributions and, ultimately, fisheries.
Differing Densities: Fresh and Salt Water
Source Institutions
In this activity, learners visualize the differences in water density and relate this to the potential consequences of increased glacial melting.

The Carbon Cycle Game
Source Institutions
In this activity, learners take on the role of a carbon atom and record which reservoirs in the carbon cycle they visit.
How does the Atmosphere keep the Earth Warmer?
Source Institutions
In this activity, learners simulate the energy transfer between the earth and space by using the light from a desk lamp desk lamp with an incandescent bulb and a stack of glass plates.
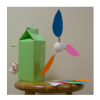
Wind Works!
Source Institutions
Learners will build and experiment with their own windmills made from simple household materials.
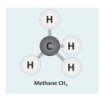
Let's Make Molecules
Source Institutions
In this activity, learners use gumdrops and toothpicks to model the composition and molecular structure of three greenhouse gases: carbon dioxide (CO2), water vapor (H2O) and methane (CH4).
The Return of El Nino
Source Institutions
In this activity related to climate change and data analysis, learners examine temperature and precipitation data to determine if climate variations are due to El Niño.
The Carbon Cycle: How It Works
Source Institutions
In this game, learners walk through an imaginary Carbon Cycle and explore the ways in which carbon is stored in reservoirs and the processes that transport the carbon atom from one location to another
Dinosaur Breath
Through discussion and hands-on experimentation, learners examine the geological (ancient) carbon cycle.
How Greenhouse Gases Absorb Heat
Source Institutions
Learners observe two model atmospheres -- one with normal atmospheric composition and another with an elevated concentration of carbon dioxide.

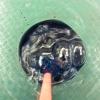
Corals on Acid
Source Institutions
The objective of this inquiry-based lesson is for learners to gain an understanding of how increasing ocean acidity can affect the calcification of marine organisms.
Trees: Recorders of Climate Change
Source Institutions
In this activity, learners are introduced to tree rings by examining a cross section of a tree, also known as a “tree cookie.” They discover how tree age can be determined by studying the rings and ho
Signs of Change: Studying Tree Rings
Source Institutions
In this very hands-on lesson, learners will investigate dendrochronology (the study of tree rings to answer ecological questions about the recent past) and come up with conclusions as to what possible
Investigating Convection
Source Institutions
This experiment is designed to illustrate how fluids, including water, have the ability to flow.
Breathing Blue
Source Institutions
In this activity, learners test exhaled breath for carbon dioxide and learn how to use an indicator as a simple way to measure pH.
Energy Audit
Source Institutions
In this lesson, learners will practice graphing and statistically analyzing data.
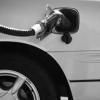
Automotive Emissions and the Greenhouse Effect
Source Institutions
In this activity about global climate change, learners will conduct an experiment and collect data to compare the amount of carbon dioxide (CO2) in four different sources of gases.