Search Results
Showing results 1 to 14 of 14

How Much Water is in that Cloud?
Source Institutions
In this activity, learners working in pairs saturate a cotton ball using water drops from an eyedropper to demonstrate the high water capacity of clouds.
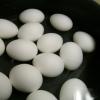
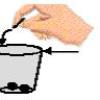
Salt 'n Lighter
Source Institutions
In this activity, learners discover that as the salinity of water increases, the density increases as well. Learners prove this by attempting to float fresh eggs in saltwater and freshwater.
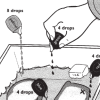
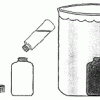
Investigating Density Currents
Source Institutions
In this lab activity, learners explore how to initiate a density current. Learners measure six flasks with different concentrations of salt and water (colored blue).
Why Doesn’t the Ocean Freeze?
Source Institutions
In this activity, learners explore how salt water freezes in comparison to fresh water.
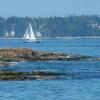
Spill Spread
Source Institutions
In this simulation, learners explore how ocean currents spread all kinds of pollution—including oil spills, sewage, pesticides and factory waste—far beyond where the pollution originates.

That Sinking Feeling
Source Institutions
In this quick activity, learners observe how salinity and temperature affect the density of water, to better understand the Great Ocean Conveyor.
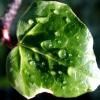
Leaf it to Me
Source Institutions
In this activity, learners observe the effect of transpiration as water is moved from the ground to the atmosphere.
Make Your Own Deep-Sea Vent
Source Institutions
In this activity, learners make a model of the hot water of a deep sea vent in the cold water of the ocean to learn about one of the ocean's most amazing and bizarre underwater habitats.
Investigating Convection
Source Institutions
This experiment is designed to illustrate how fluids, including water, have the ability to flow.
The Rain Man
Source Institutions
In this activity, learners observe the hydrologic cycle in action as water evaporates and condenses to form rain right before their eyes.
Water Ways
Source Institutions
In this activity (on page 2 of the PDF), learners explore surface tension by adding pennies to cups which are "full" of plain water or soapy water.

Heat Capacity: Can't Take the Heat?
Source Institutions
Why is ocean water sometimes the warmest when the average daily air temperature starts to drop? In this activity, learners explore the differing heat capacities of water and air using real data.
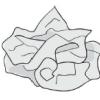
Crumple a Watershed
Source Institutions
Learners gain an intuitive knowledge of the physical aspects of watersheds by creating their own watershed models.
Mystery of the Disappearing Cottonwoods
Source Institutions
Learners will explore the scientific mystery behind a disappearing group of trees by examining data and attempting to explain the decline.