Search Results
Showing results 21 to 38 of 38

How Might Elevated CO2 Affect Plants
Source Institutions
In this activity, learners conduct an experiment to investigate the effect of elevated levels on CO2 on plant growth.
Capturing Carbon Dioxide
Source Institutions
In this activity, learners investigate carbon sequestration by creating a carbonated beverage out of apple juice and dry ice.

Water, Water Everywhere
Source Institutions
In this activity, learners estimate how much water they think can be found in various locations on the Earth in all its states (solid, liquid, and gas) to discover the different water ratios in the Ea

The Carbon Cycle and its Role in Climate Change: Activity 2
Source Institutions
In this activity (on page 7), learners explore the meaning of a "carbon sink." Using simple props, learners and/or an educator demonstrate how plants act as carbon sinks and how greenhouse gases cause
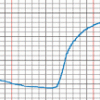
The Daily Ups and Downs
Source Institutions
In this activity, learners graph 48 hourly air temperatures from a local weather observation site and observe the diurnal temperature variations.

What is a "Model"?
Source Institutions
In this activity, learners simulate the behavior of the atmosphere.

What does Color have to do with Cooling?
Source Institutions
In this demonstration/experiment, learners discover that different colors and materials (metals, fabrics, paints) radiate different amounts of energy and therefore, cool at different rates.
Why is the Sky Purple?
Source Institutions
This simple hands-on activity demonstrates why the sky appears blue on a sunny day and red during sunrise and sunset.
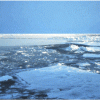
Arctic Sea Ice
Source Institutions
In this activity, learners explore how the area of Arctic sea ice has changed over recent years. First, learners graph the area of Arctic sea ice over time from 1979 to 2007.
It's a Gas, Man
Source Institutions
In this activity, learners discover if carbon dioxide has an effect on temperature.
Glue Stick Sunset
Source Institutions
In this activity, learners explore why the sky is blue. Learners model the scattering of light by the atmosphere, which creates the blue sky and red sunset, using a flashlight and clear glue sticks.
Sea State: Forecast Conditions at Sea
Source Institutions
In this oceanography and data collection activity, learners cast real time sea state conditions using buoys from NOAA's National Data Buoy Center.
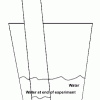
Percentage of Oxygen in the Air
Source Institutions
In this activity, learners calculate the percentage of oxygen in the atmosphere by using steel wool's ability to rust.

Make Your Own Weather Station
Source Institutions
This three-part activity shows learners how to build three meteorology tools: a wind vane, a rain gauge, and a barometer.
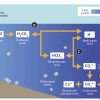
Coral, Carbon Dioxide and Calcification
Source Institutions
In this group activity, learners act out key stages of the "ocean carbon cycle" (also known as the "carbonate buffer system") through motions, rearranging blocks and team tasks.

The Carbon Cycle and its Role in Climate Change: Activity 3
Source Institutions
In this activity, learners explore the human influences on the carbon cycle and examine how fossil fuels release carbon.
Atmosphere Composition Model
Source Institutions
In this activity, learners create a model using metric measuring tapes and atmosphere composition data.
The Rain Man
Source Institutions
In this activity, learners observe the hydrologic cycle in action as water evaporates and condenses to form rain right before their eyes.
