Search Results
Showing results 1 to 20 of 85
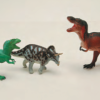
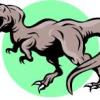
Join the Dinosaur Age
Source Institutions
In this activity, learners rotate through several learning and play stations to explore dinosaurs and paleontologists.
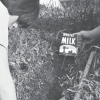
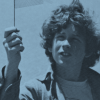
Disease Detective
Source Institutions
This activity (on pages 35-43) lets learners analyze a "herd of elk" to detect the spread of a bacterial disease called brucellosis.
Hold a Hill
Source Institutions
In this outdoor activity, learners investigate the relationship between the slope of a trail and soil erosion.
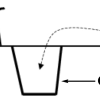
Investigating Density Currents
Source Institutions
In this lab activity, learners explore how to initiate a density current. Learners measure six flasks with different concentrations of salt and water (colored blue).
Bean Bugs
Source Institutions
In this outdoor biology and math activity, learners estimate the size of a population of organisms too numerous to count.
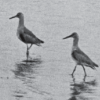
Flocking for Food
Source Institutions
In this outdoor beach activity, learners use a variety of "beaks" (such as trowels, spoons or sticks) to hunt for organisms that shore birds might eat.
Animal Diversity
Source Institutions
In this outdoor activity, learners find, count and compare as many different kinds of animals as they can find in two different areas: a managed lawn and a weedy area.
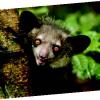
Aye-Aye
Source Institutions
This is an activity about the adaptations that allow the Aye-aye to survive in its habitat. Learners will explore how the Aye-aye collects food and how this is influenced by their specialized finger.
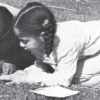
Counting With Quadrants
Source Institutions
Millions of organisms can live in and around a body of water.
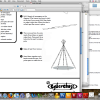
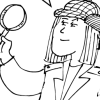
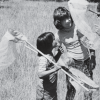
Make a Tikiville Teepee
Source Institutions
In this great hands-on activity, learners use patterns to make a teepee from newspaper that they sit inside.
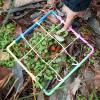
Hunting Minibeasts
Source Institutions
In this activity (p.6-10 of PDF), learners use different methods for hunting minibeasts (bugs). Learners can either make traps or simply look for minibeasts under stones and logs.
Terrestrial Hi-Lo Hunt
Source Institutions
In this outdoor activity, learners search for the warmest and coolest, windiest and calmest, wettest and driest, and brightest and darkest spots in an area.
Trees: Recorders of Climate Change
Source Institutions
In this activity, learners are introduced to tree rings by examining a cross section of a tree, also known as a “tree cookie.” They discover how tree age can be determined by studying the rings and ho
Understanding Albedo
Source Institutions
In this activity related to climate change, learners examine albedo and the ice albedo feedback effect as it relates to snow, ice, and the likely results of reduced snow and ice cover on global temper

Mapping Sea Level Rise
Source Institutions
In this activity related to climate change, learners create and explore topographical maps as a means of studying sea level rise.
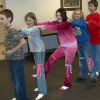
The Bug Walk
Source Institutions
In this fun group activity involving music and movement, learners are introduced to the idea that many insects walk by using their legs to create "alternating triangles." Learners sing the "Ants Go Ma
What's the Angle?
Source Institutions
This activity helps learners understand how the angle of the Sun affects temperatures around the globe.
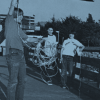
OBIS Oil Spill
Source Institutions
In this outdoor activity, learners simulate an oil spill using popcorn (both oil and popcorn float on water), and estimate the spill's impact on the environment.
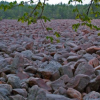
How Boulders Are Born
Source Institutions
In this activity, learners review and discuss weathering, erosion and mass wasting, to gain a stronger understanding of how Hickory Run’s Boulder Field was formed after the Laurentide Continental Glac
Dinosaur Breath
Through discussion and hands-on experimentation, learners examine the geological (ancient) carbon cycle.