Search Results
Showing results 1 to 20 of 47
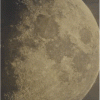
From the Internet to Outer Space
Source Institutions
In this activity, learners will use Google Sky to observe features of the night sky and share their observations.
Glaciers
Source Institutions
In this online activity, learners adjust mountain snowfall and temperature to see how glaciers grow and shrink. They will use scientific tools to measure thickness, velocity and glacial budget.
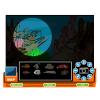
Underwater ROV
Source Institutions
In this online Flash game, learners will explore a coral reef using an underwater remotely operated vehicle (ROV).

Sidewalk Constellations
Source Institutions
In this activity, learners will go outside and create a constellation.
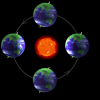
The Four Seasons
Source Institutions
In this lesson that includes hands-on activities and demonstrations, learners discover that it is the tilt of the Earth's axis (not its proximity to the sun) that causes the seasons.

A Cubic Foot Per Second
Source Institutions
In this activity, learners measure and calculate the amount of cubic feet various containers contain. Next, learners investigate cubic feet per second (cps), by carrying jugs in one second.

Whose Fault Is It?
Source Institutions
In this seismic simulation, learners play a "who-dunnit" game to explore earthquakes.

Arctic Sea Ice
Source Institutions
In this activity, learners explore how the area of Arctic sea ice has changed over recent years. First, learners graph the area of Arctic sea ice over time from 1979 to 2007.
Let's Count Humpback Whales: Environmental Effects on Population
Source Institutions
In this activity, learners use whale count data from the Hawaiian Islands Humpback Whale National Marine Sanctuary to compare whale counts in relation to environmental factors.
Crunch Time
Source Institutions
In this quick and easy activity and/or demonstration, learners use two empty 2-liter bottles and hot tap water to illustrate the effect of heat on pressure.
Twist and Spout
Source Institutions
In this activity, learners make their own "tornado" using two soda bottles and water.
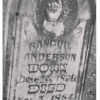
Gravestone Weathering
Source Institutions
In this activity (located on pages 9-14 of PDF), learners visit a cemetery to examine the distinguishing characteristics of rock weathering.
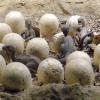
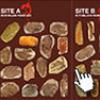
Build A Dinosaur Nest
Source Institutions
In this outdoor activity, learners will gather natural materials outside that they think a dinosaur would want to lay its eggs in.
Toasty Wind
Source Institutions
In this quick activity, learners use a toaster to investigate the source for the Earth's wind. Learners hold a pinwheel above a toaster to discover that rising heat causes wind.

Mapping Greenhouse Gas Emissions Where You Live
Source Institutions
In this lesson plan, learners examine some of the of greenhouse gas emissions sources in their community.
Prehistoric Climate Change
Source Institutions
In this online interactive, learners use fossils to infer temperatures 55 million years ago, at the sites where the fossils were found.
A Pressing Engagement
Source Institutions
In this quick and easy activity and/or demonstration, learners illustrate the effect of the weight of air over our heads.
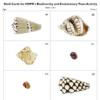
Biodiversity and Evolutionary Trees
Source Institutions
In this interactive activity, learners analyze seashells to explore phylogeny and evolution. Learners identify similar and dissimilar seashells to create a phylogenetic tree.

Coral Snapshots: Biodiversity in Marine Protected Areas
Source Institutions
In this data activity, learners analyze data from coral reef snapshots taken by scientists at the Virginia Institute of Marine Science.
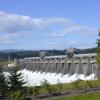
The Best Dam Simulation Ever
Source Institutions
This online simulation game explores the different consequences of water levels on the Columbia River in the Pacific Northwest.