Search Results
Showing results 1 to 20 of 53
Chemical Footprint—Family Activity
Source Institutions
In this multi-part activity learners examine non-point water pollution.

Glaciers
Source Institutions
In this online activity, learners adjust mountain snowfall and temperature to see how glaciers grow and shrink. They will use scientific tools to measure thickness, velocity and glacial budget.

The Rumblin' Road: Determining distance to a Thunderstorm
Source Institutions
In this activity, learners discover how to determine the distance to a lightning strike or nearby thunderstorm.

Quadraphonic Wind
Source Institutions
In this activity, learners discover how the extent of various wind speeds changes in each of the four quadrants around a hurricane.
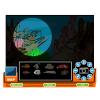
Underwater ROV
Source Institutions
In this online Flash game, learners will explore a coral reef using an underwater remotely operated vehicle (ROV).
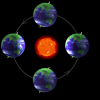
The Four Seasons
Source Institutions
In this lesson that includes hands-on activities and demonstrations, learners discover that it is the tilt of the Earth's axis (not its proximity to the sun) that causes the seasons.
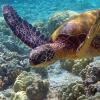
Habitat Adaptation Matchup
Source Institutions
In this activity, learners work in small groups to match various marine animals with their different environments.

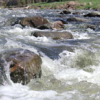
A Cubic Foot Per Second
Source Institutions
In this activity, learners measure and calculate the amount of cubic feet various containers contain. Next, learners investigate cubic feet per second (cps), by carrying jugs in one second.

Whose Fault Is It?
Source Institutions
In this seismic simulation, learners play a "who-dunnit" game to explore earthquakes.

Arctic Sea Ice
Source Institutions
In this activity, learners explore how the area of Arctic sea ice has changed over recent years. First, learners graph the area of Arctic sea ice over time from 1979 to 2007.
Let's Count Humpback Whales: Environmental Effects on Population
Source Institutions
In this activity, learners use whale count data from the Hawaiian Islands Humpback Whale National Marine Sanctuary to compare whale counts in relation to environmental factors.
Fish Communities: National Marine Sanctuaries
Source Institutions
In this data activity, learners will compare and contrast fish communities, diversity and habitats in U.S. National Marine Sanctuaries.
Crunch Time
Source Institutions
In this quick and easy activity and/or demonstration, learners use two empty 2-liter bottles and hot tap water to illustrate the effect of heat on pressure.
Catch & Release II: It's Catching On!
Source Institutions
Throw that fish back? A new generation of ethical anglers concerned about conserving resources is participating in "catch and release" fishing. How is this going?
Gravestone Weathering
Source Institutions
In this activity (located on pages 9-14 of PDF), learners visit a cemetery to examine the distinguishing characteristics of rock weathering.

Toasty Wind
Source Institutions
In this quick activity, learners use a toaster to investigate the source for the Earth's wind. Learners hold a pinwheel above a toaster to discover that rising heat causes wind.

Mapping Greenhouse Gas Emissions Where You Live
Source Institutions
In this lesson plan, learners examine some of the of greenhouse gas emissions sources in their community.
A Pressing Engagement
Source Institutions
In this quick and easy activity and/or demonstration, learners illustrate the effect of the weight of air over our heads.

Coral Snapshots: Biodiversity in Marine Protected Areas
Source Institutions
In this data activity, learners analyze data from coral reef snapshots taken by scientists at the Virginia Institute of Marine Science.
The Carbon Cycle and its Role in Climate Change: Activity 2
Source Institutions
In this activity (on page 7), learners explore the meaning of a "carbon sink." Using simple props, learners and/or an educator demonstrate how plants act as carbon sinks and how greenhouse gases cause