Search Results
Showing results 81 to 100 of 176

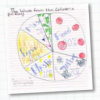
What's the Difference between Weather and Climate?
Source Institutions
In this interactive and informative group activity, learners use packages of M&M's to illustrate the difference between weather and climate.
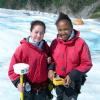
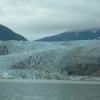
Mini Glacier Meltdown
Source Institutions
This activity (located on page 3 of the PDF under GPS: Glaciers Activity) is a full inquiry investigation about the different causes of glacial melt.
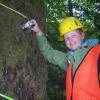
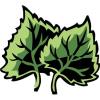
Tree Trunk Diameter to Branch Height Relationship
Source Institutions
In this activity (located on page 2 of the PDF under GPS: Temperate Rain Forest Activity), learners will identify a group of deciduous trees to study.
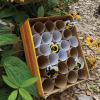
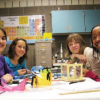
Pollinator Play
Source Institutions
In this activity, learners will build a bee hotel for pollinators. Learners will explore building and ecology through this activity.
Fish Eyes: More than Meets the Eye
Source Institutions
In this data collection and analysis activity, learners evaluate fish physiology and ecology using vision research data from Dr.
Going Green
Source Institutions
In this activity, learners conduct a waste audit and use their findings to implement a plan for reducing trash.
Shower Estimation
Source Institutions
In this activity, learners calculate their water usage (in cups and galloons) during an average shower. Learners also chart and analyze water usage during showers in their households.
Moving Model Glacier
Source Institutions
In this goopy activity (page 2 of PDF under GPS: Glaciers Activity), learners will model glacial movement with “gak,” a white glue and liquid starch mixture.
Mountains in the Sea
Source Institutions
In this 6-7 day investigation, learners begin with an introduction to seamounts that are present in the Gulf of Alaska.
Liesegang Rings
Source Institutions
This display shows slow chemical reactions in colorful crystal formations known as Liesegang Rings. These reactions are similar to those forming the rings in agates.

The Daily Ups and Downs
Source Institutions
In this activity, learners graph 48 hourly air temperatures from a local weather observation site and observe the diurnal temperature variations.
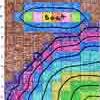
Creating a Soil Map
Source Institutions
In this activity, learners investigate soil conditions by creating a soil map. Learners record soil characteristics and compare the conditions of soil in different grid sections.
Fossil Age Estimation Model
Source Institutions
In this activity (page 1 of the PDF under SciGirls Activity: Dinosaurs), learners will model how paleontologists estimate the age of fossil discoveries by extracting “fossil” playing cards from newspa
We all Scream for Ice Cream
Source Institutions
In this activity, learners observe how salinity affects the freezing point of water by making and enjoying ice cream.
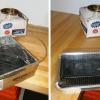
Solar Water Heater
Learners work in teams to design and build solar water heating devices that mimic those used in residences to capture energy in the form of solar radiation and convert it to thermal energy.
Trash Talkin'
In this activity, learners collect, categorize, weigh and analyze classroom trash and discuss ways that engineers have helped to reduce solid waste.
Investigating and Using Biomass Gases
Source Institutions
In this activity, learners will be introduced to biomass gasification and will generate their own biomass gases.
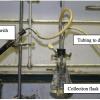
Determining the Amount of Transpiration from a Schoolyard Tree
Source Institutions
In this activity, learners calculate the number of milliliters of water a nearby tree transpires per day.
House Warming
Source Institutions
In this physical sciences activity, learners explore how passive solar design increases energy efficiency.
The Return of El Nino
Source Institutions
In this activity related to climate change and data analysis, learners examine temperature and precipitation data to determine if climate variations are due to El Niño.