Search Results
Showing results 1 to 8 of 8
Plot the Dot: A Graphical Approach to Density
Source Institutions
In this activity, learners work in groups to determine the mass and volume of four samples: glass marbles, steel washers or nuts, pieces of pine wood, and pieces of PVC pipe.
Transit Tracks
Source Institutions
In this space science activity, learners explore transits and the conditions when a transit may be seen.
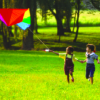
How Active Are You?
Source Institutions
In this activity, learners explore what is and is not active play and how it contributes to a healthy body and mind. Making active play a routine part of every day is a key concept of the experience.
Patterns and Functions: Fill 'er Up
Source Institutions
In this math lesson, learners predict, interpret, and sketch graphs of functions related to the shapes of bottles. A measure of water is poured into a container.
Tourist Town: Dominating Sets
Source Institutions
In this activity, learners use a fictitious map of "Tourist Town" and counters to problem solve how to place ice-cream vans on street intersections so that every other intersection is connected to one
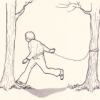
Tree Tally
Source Institutions
In this outdoor activity and fun race, learners first find the most common type of tree in a forest site.

Arctic Sea Ice
Source Institutions
In this activity, learners explore how the area of Arctic sea ice has changed over recent years. First, learners graph the area of Arctic sea ice over time from 1979 to 2007.
Bloomin' Bud Glyph
Source Institutions
In this math lesson, learners practice reading charts and graphs by creating and interpreting glyphs.