Search Results
Showing results 1 to 8 of 8
Quick Questions: Create a Survey
Source Institutions
In this activity, learners will conduct an open-ended survey, and then organize and analyze results. What languages does everyone speak? What’s the most common? the least common?
Plot the Dot: A Graphical Approach to Density
Source Institutions
In this activity, learners work in groups to determine the mass and volume of four samples: glass marbles, steel washers or nuts, pieces of pine wood, and pieces of PVC pipe.
The Muddy City: Minimal Spanning Trees
Source Institutions
In this puzzle, learners investigate the decisions involved in linking a network between houses in a muddy city.
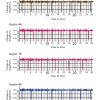
Transit Tracks
Source Institutions
In this space science activity, learners explore transits and the conditions when a transit may be seen.

Zoo Calendar
Source Institutions
Use the Zoo Calendar (page 1 of PDF) to involve learners in interdisciplinary, whole language, and writing activities about ecological concepts.

Arctic Sea Ice
Source Institutions
In this activity, learners explore how the area of Arctic sea ice has changed over recent years. First, learners graph the area of Arctic sea ice over time from 1979 to 2007.
Starburst® Graph
Source Institutions
In this activity, learners use Starburst® candy to sort, classify, compare, and graph. Learners grab a handful of one-inch candy squares, sort them by color, graph the candy, and discuss the results.
Graph Dance
Source Institutions
In this activity, learners "dance" (move back and forth at varying speeds) by reading a graph. This is a kinesthetic way to help learners interpret and understand how motion is graphed.