Search Results
Showing results 1 to 6 of 6
Plot the Dot: A Graphical Approach to Density
Source Institutions
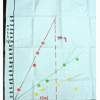
In this activity, learners work in groups to determine the mass and volume of four samples: glass marbles, steel washers or nuts, pieces of pine wood, and pieces of PVC pipe.
Paper Tape Motion Timer
Source Institutions
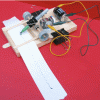
In this activity, learners build a recording timer made from simple materials (e.g., small dc motor, sharpie pen, craft sticks, adding machine paper tape, etc.).

Pi Toss
Source Institutions
In this activity, learners explore a surprising method for calculating the mathematical constant pi, known as Buffon's Needle.
Radioactive-Decay Model: Substitute coins for radiation
Source Institutions
Get a roll of pennies, throw them on the ground, then remove those that only show tails, and repeat with the ones left over.
Graph Dance
Source Institutions
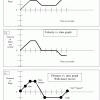
In this activity, learners "dance" (move back and forth at varying speeds) by reading a graph. This is a kinesthetic way to help learners interpret and understand how motion is graphed.
Pi Graph
Source Institutions
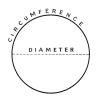
In this activity, learners use a straight line to learn about circles. Learners measure and record the diameter and circumference of different sized cylindrical objects on a chart.
