Search Results
Showing results 1 to 8 of 8

Quadraphonic Wind
Source Institutions
In this activity, learners discover how the extent of various wind speeds changes in each of the four quadrants around a hurricane.
Where Does the Wind Blow?
Source Institutions
In this activity, learners investigate wind by comparing the force of wind in different locations. Learners build wind-o-meters out of wooden sticks and strips of paper.
The Return of El Nino
Source Institutions
In this activity related to climate change and data analysis, learners examine temperature and precipitation data to determine if climate variations are due to El Niño.
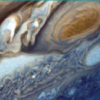
Weather Stations: Storms
Source Institutions
In this activity, learners test how cornstarch and glitter in water move when disturbed. Learners compare their observations with videos of Jupiter's and Earth's storm movements.
Without An Ark: The Effects of Storms and Floods
Source Institutions
April showers bring May flowers, but what do coastal storms bring?

Why do Hurricanes go Counterclockwise in the Northern Hemisphere?
Source Institutions
In this kinesthetic activity, learners will play a game with a ball to demonstrate the Coriolis force, which partly explains why hurricanes in the Northern Hemisphere rotate counterclockwise.

A Hurricane's Storm Surge Affects our Estuaries
Source Institutions
In this activity, learners construct a coastal landmass from sand and add features such as tidal creeks and barrier islands.
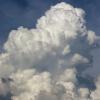
Convection
Source Institutions
In this activity, learners model atmospheric convection currents using food coloring, water, and clear cups. Activity includes step-by-step instructions, STEM connections, and more.