Search Results
Showing results 1 to 6 of 6
Sharks: Taking a Bite Out of The Myth
Source Institutions
In this activity, learners will explore trends in shark populations using shark landing data from the National Marine Fisheries Service.
Sustainable Fishing
Source Institutions
In this activity, learners use a model for how fishing affects marine life populations, and will construct explanations for one of the reasons why fish populations are declining.
Ocean Home: Swimming Fishes
Source Institutions
In this activity, learners model, on a human-sized board game, how changes in water temperature may affect fish distributions and, ultimately, fisheries.
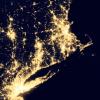
Where Do We Choose to Live and Why?
Source Institutions
In this geography investigation, learners use a nighttime satellite image to observe areas of light across the United States and to identify patterns and spatial distributions of human settlements.

Chilean Sea Bass: Off the Menu
Source Institutions
In this data analysis activity, learners use data collected by the Commission for the Conservation of Antarctic Marine Living Resources (CCAMLR) to study Chilean sea bass populations.
Mystery of the Disappearing Cottonwoods
Source Institutions
Learners will explore the scientific mystery behind a disappearing group of trees by examining data and attempting to explain the decline.